
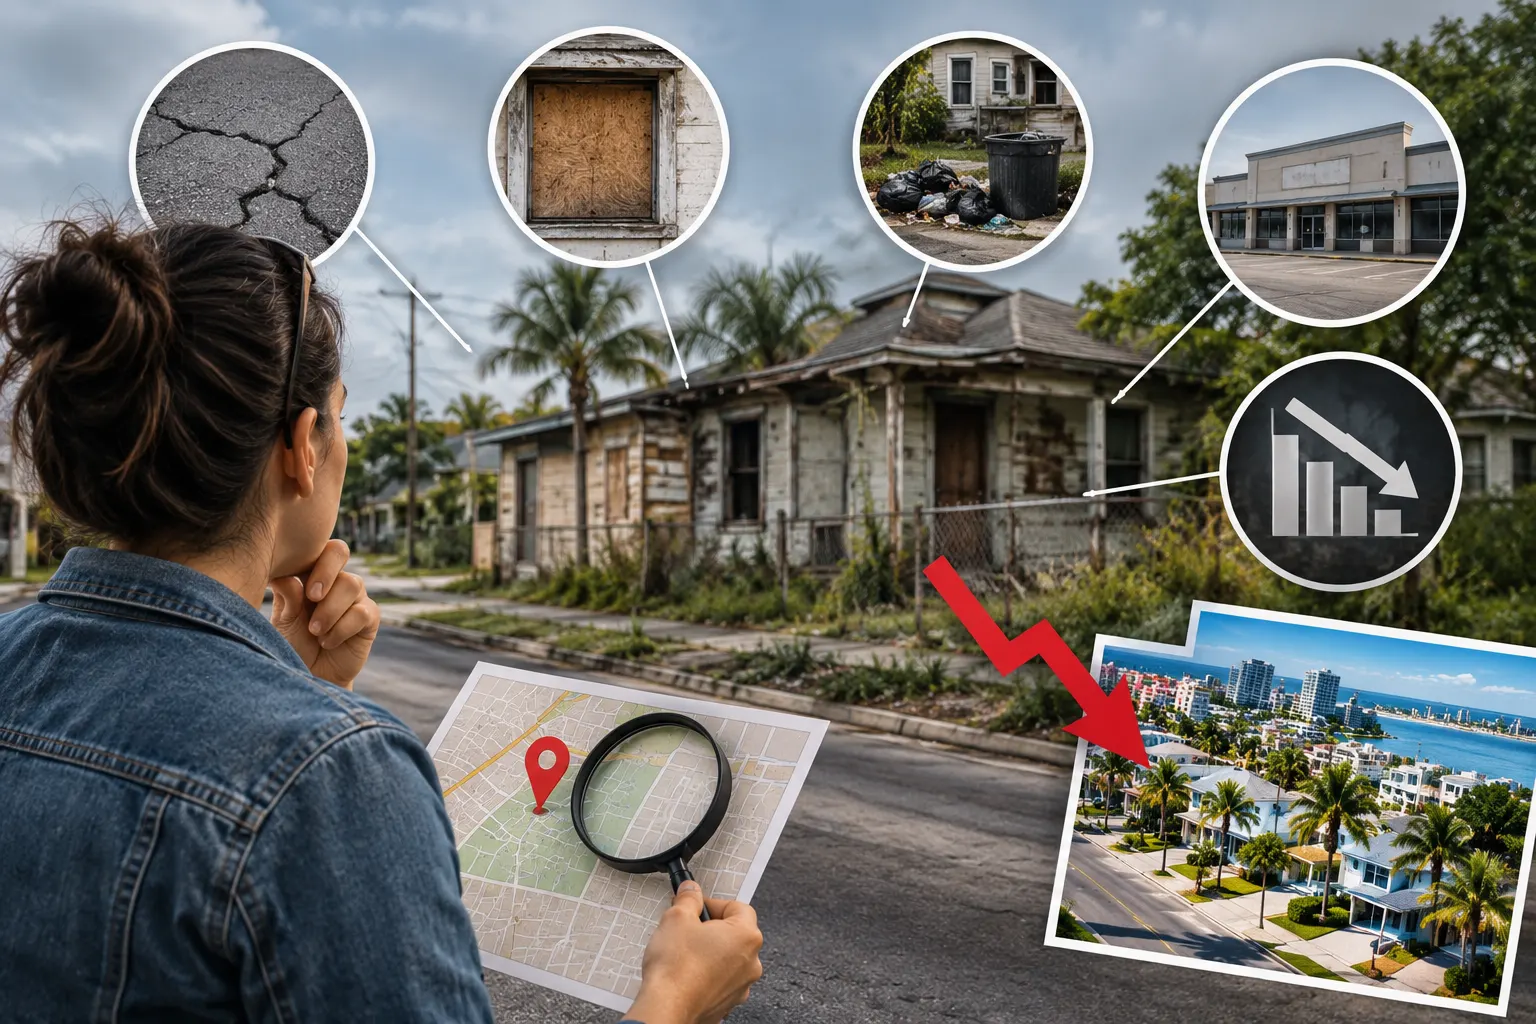
Days on market climbs first, often 10% to 25% before prices move at all. Watch falling owner-occupancy, declining building permits, and shrinking school enrollment, which leads rating changes by three to five years. Boarded windows and empty storefronts only confirm decline that already happened. In South Florida, insurance costs and condo assessments drive most of it.
South Florida Rarely Declines the Classic Way
The question assumes a pattern this market seldom follows, and correcting that assumption changes where you should look. On the Discover South Florida Podcast, Larry Mastropieri reframed it immediately.
"I don't think we generally experience declining areas so much in South Florida. Most of the conversations we're having is how quickly are they improving, and when should you buy in to get the best IRR."
Entry timing drives those discussions far more than decay does.
"When do you slip in? Is it too early to get in?"
Buyers here more often misjudge the pace of improvement than walk into genuine deterioration. A neighborhood expected to turn in three years that takes fifteen produces the same disappointment as decline, though the underlying cause differs entirely.
Which Signals Appear First?
Early indicators show up in transaction data long before anything looks different from the street. These move first.
- Days on market climbing 10% to 25% without any broader economic event.
- Sale-to-list ratios weakening as sellers accept steeper discounts.
- Homes selling at the same speed but for less money than a year ago.
- Active inventory building while nearby areas stay balanced.
- Owner-occupancy falling as absentee ownership rises.
- A drop in building permit activity, since construction signals confidence.
- School enrollment shrinking, which precedes rating declines by three to five years.
- Code enforcement violations rising across a concentrated area.
Why Days on Market Moves Before Price
Sellers resist lowering prices long after demand softens, so the first evidence appears in how long listings sit. Hesitation shows on the calendar well before it reaches closed sale figures.
A related pattern deserves attention as well. Homes that sell quickly but at flat or falling prices signal that buyers will transact only at a discount, which often precedes an outright drop. Compare your target area against the surrounding submarket instead of the metro average, since trends diverge sharply within a single zip code. Buyers weighing Delray Beach and Boca Raton pockets see that divergence constantly.
The Signs That Arrive Too Late
Visible deterioration confirms a decline that already occurred, and Larry says so directly.
"When you start to see more and more properties get boarded, bombed out, that's a sign that things are going in the wrong direction. That's kind of too late, right?"
Empty storefronts, overgrown yards, and neglected exteriors all belong to this category. They describe where an area has been instead of the direction it now travels, which makes them useless for timing an entry.
Stalled Projects Are the Local Tell
Larry identifies a signal specific to how this market actually works, and it involves land nobody is building on.
"In South Florida it's unique. Projects are not getting done. They own the dirt and they're holding."
The interpretation splits two ways.
"It's either not the right time for these builders, developers, or they're having some internal issue that's affecting this."
Developers hold land when the numbers stop working, so several stalled projects across one submarket suggests professionals reached the same conclusion independently. Buyers watching West Palm Beach and similar growth corridors should track which approved projects actually break ground.
Unsure whether a neighborhood is turning or stalling? Talk to a real estate agent near Boca Raton who tracks these submarkets weekly and will show you the data instead of an opinion. Reach out to The Mastropieri Group or call (561) 544-7000.
Drive It Before You Buy It
Larry's most practical advice costs nothing and requires only patience.
"You test the market, or you understand your neighborhood that you're looking to buy into, by driving it all different times of the day, weekend, weekday. That will help give you insight into how this place feels."
One variable changes the experience more than most buyers expect.
"You can drive a neighborhood on a beautiful sunny day and have one emotional reaction, and then drive it on a cloudy rainy day and have a completely different reaction."
What a SWAT Team Taught Him
A purchase from 2015 illustrates the cost of skipping that step, and Larry tells it against himself.
"I love this neighborhood. And that's how I bought a property in 2015. Every day we went there it was beautiful. We went there in the daytime."
Reality arrived on schedule.
"We bought this thing, and the day after, a SWAT team stormed the house and pulled out a drug dealer that was running from the DEA."
His conclusion is the lesson worth carrying.
"If I had just spent a little bit more time there on rainy days, I might not have bought that building."
The timing story matters as much as the raid. He expected the area to turn quickly, and it did not.
"We were like, hey, this neighborhood's going to change, we're going to be super pumped about it. And then it's taken way longer. It's still 10 years out at least from changing."
Does Construction Mess Mean Trouble?
One pattern fools buyers regularly, and it points in the encouraging direction. Active renovation looks disruptive while it happens, so a block full of dumpsters, permits, and contractor trucks reads as chaos to an untrained eye.
That activity signals confidence instead of trouble. Investors renovate where they expect returns, and the street that looks worst during a construction season frequently outperforms its neighbors afterward. Separate that mess from genuine neglect by checking whether the work actually progresses. Streets across Palm Beach County have turned this way repeatedly.
How Declines Actually Happen Here
South Florida produces its own distinct forms of localized decline, and none resemble the classic urban pattern. These mechanisms hit specific buildings and pockets instead of whole neighborhoods.
- Insurance costs rising until buyers cannot afford the total monthly payment.
- Carriers declining coverage entirely on older roofs or aging construction.
- Condo assessments following milestone inspections that reset a building's value.
- Reserve funding requirements pushing association fees beyond what buyers accept.
- Flood map revisions adding insurance requirements to previously exempt properties.
- Lost financing eligibility when a project falls off approved lender lists.
A single condominium can lose substantial value while the surrounding neighborhood appreciates. Buyers evaluating Broward County condos should investigate the building's finances as carefully as the area's trend line.
Separating Noise From Genuine Signal
Individual events rarely mean much on their own, and reading them correctly requires proportion. One restaurant closing tells you almost nothing, since turnover in food service runs high everywhere.
Anchor institutions carry the real weight. A hospital consolidating, a major employer relocating, or a campus reducing programs affects household formation across an entire area for years. Watch what leaves instead of counting how many things leave.
Larry adds perspective for anyone buying with a long horizon.
"We're long-term holders, so none of that really matters."
A rough patch during a fifteen-year hold looks nothing like the same conditions during a three-year flip. Match your read to the timeline you actually intend, which investors in Palm Beach Gardens and beyond often skip.
Where to Find These Numbers Yourself
- MLS data through an agent for days on market and sale-to-list ratios by neighborhood.
- County permit portals showing construction activity and code enforcement history.
- Property appraiser records revealing ownership patterns and homestead percentages.
- School district enrollment reports published annually by most districts.
- Census American Community Survey data for migration and income trends.
- Municipal planning agendas listing approved projects and their status.
Market conditions shift continuously, and this page describes general patterns. Your agent should pull current neighborhood-level data before you commit to anything.
Read the Numbers, Then Drive the Street
A neighborhood shifts in the data months before anyone notices it on the street. Once you can see the change, the pricing has already adjusted. We pull days on market trends, permit activity, and ownership patterns for the pockets you are weighing, then tell you honestly what the numbers suggest. Reach out to The Mastropieri Group, Realtors® at (561) 544-7000 and name the neighborhoods you are weighing and we will show you where each one is heading.