
After a year of adjustments, both Palm Beach and Broward counties are showing signs of tightening. Inventory is falling, absorption rates are improving, and the market is starting to favor sellers again in key price segments.
Key Takeaways
- Palm Beach average prices up 11% while inventory fell 8%.
- Both counties now have seller's markets in the $500K to $750K range.
- New listings dropped sharply: Palm Beach down 11%, Broward down 15%.
The first quarter of 2026 told a story few expected. After watching inventory climb throughout 2025, both Palm Beach County and Broward County saw supply drop for the first time in over two years. New listings are down significantly. Under-contract activity is up. And absorption rates improved across nearly every price segment in both counties. If you have been waiting for clarity on where this market is headed, Q1 2026 gave us real answers.
Data sourced from MLS records for Palm Beach and Broward counties, comparing Q1 2025 to Q1 2026 (January through March).
How long are homes sitting on the market in Q1 2026?
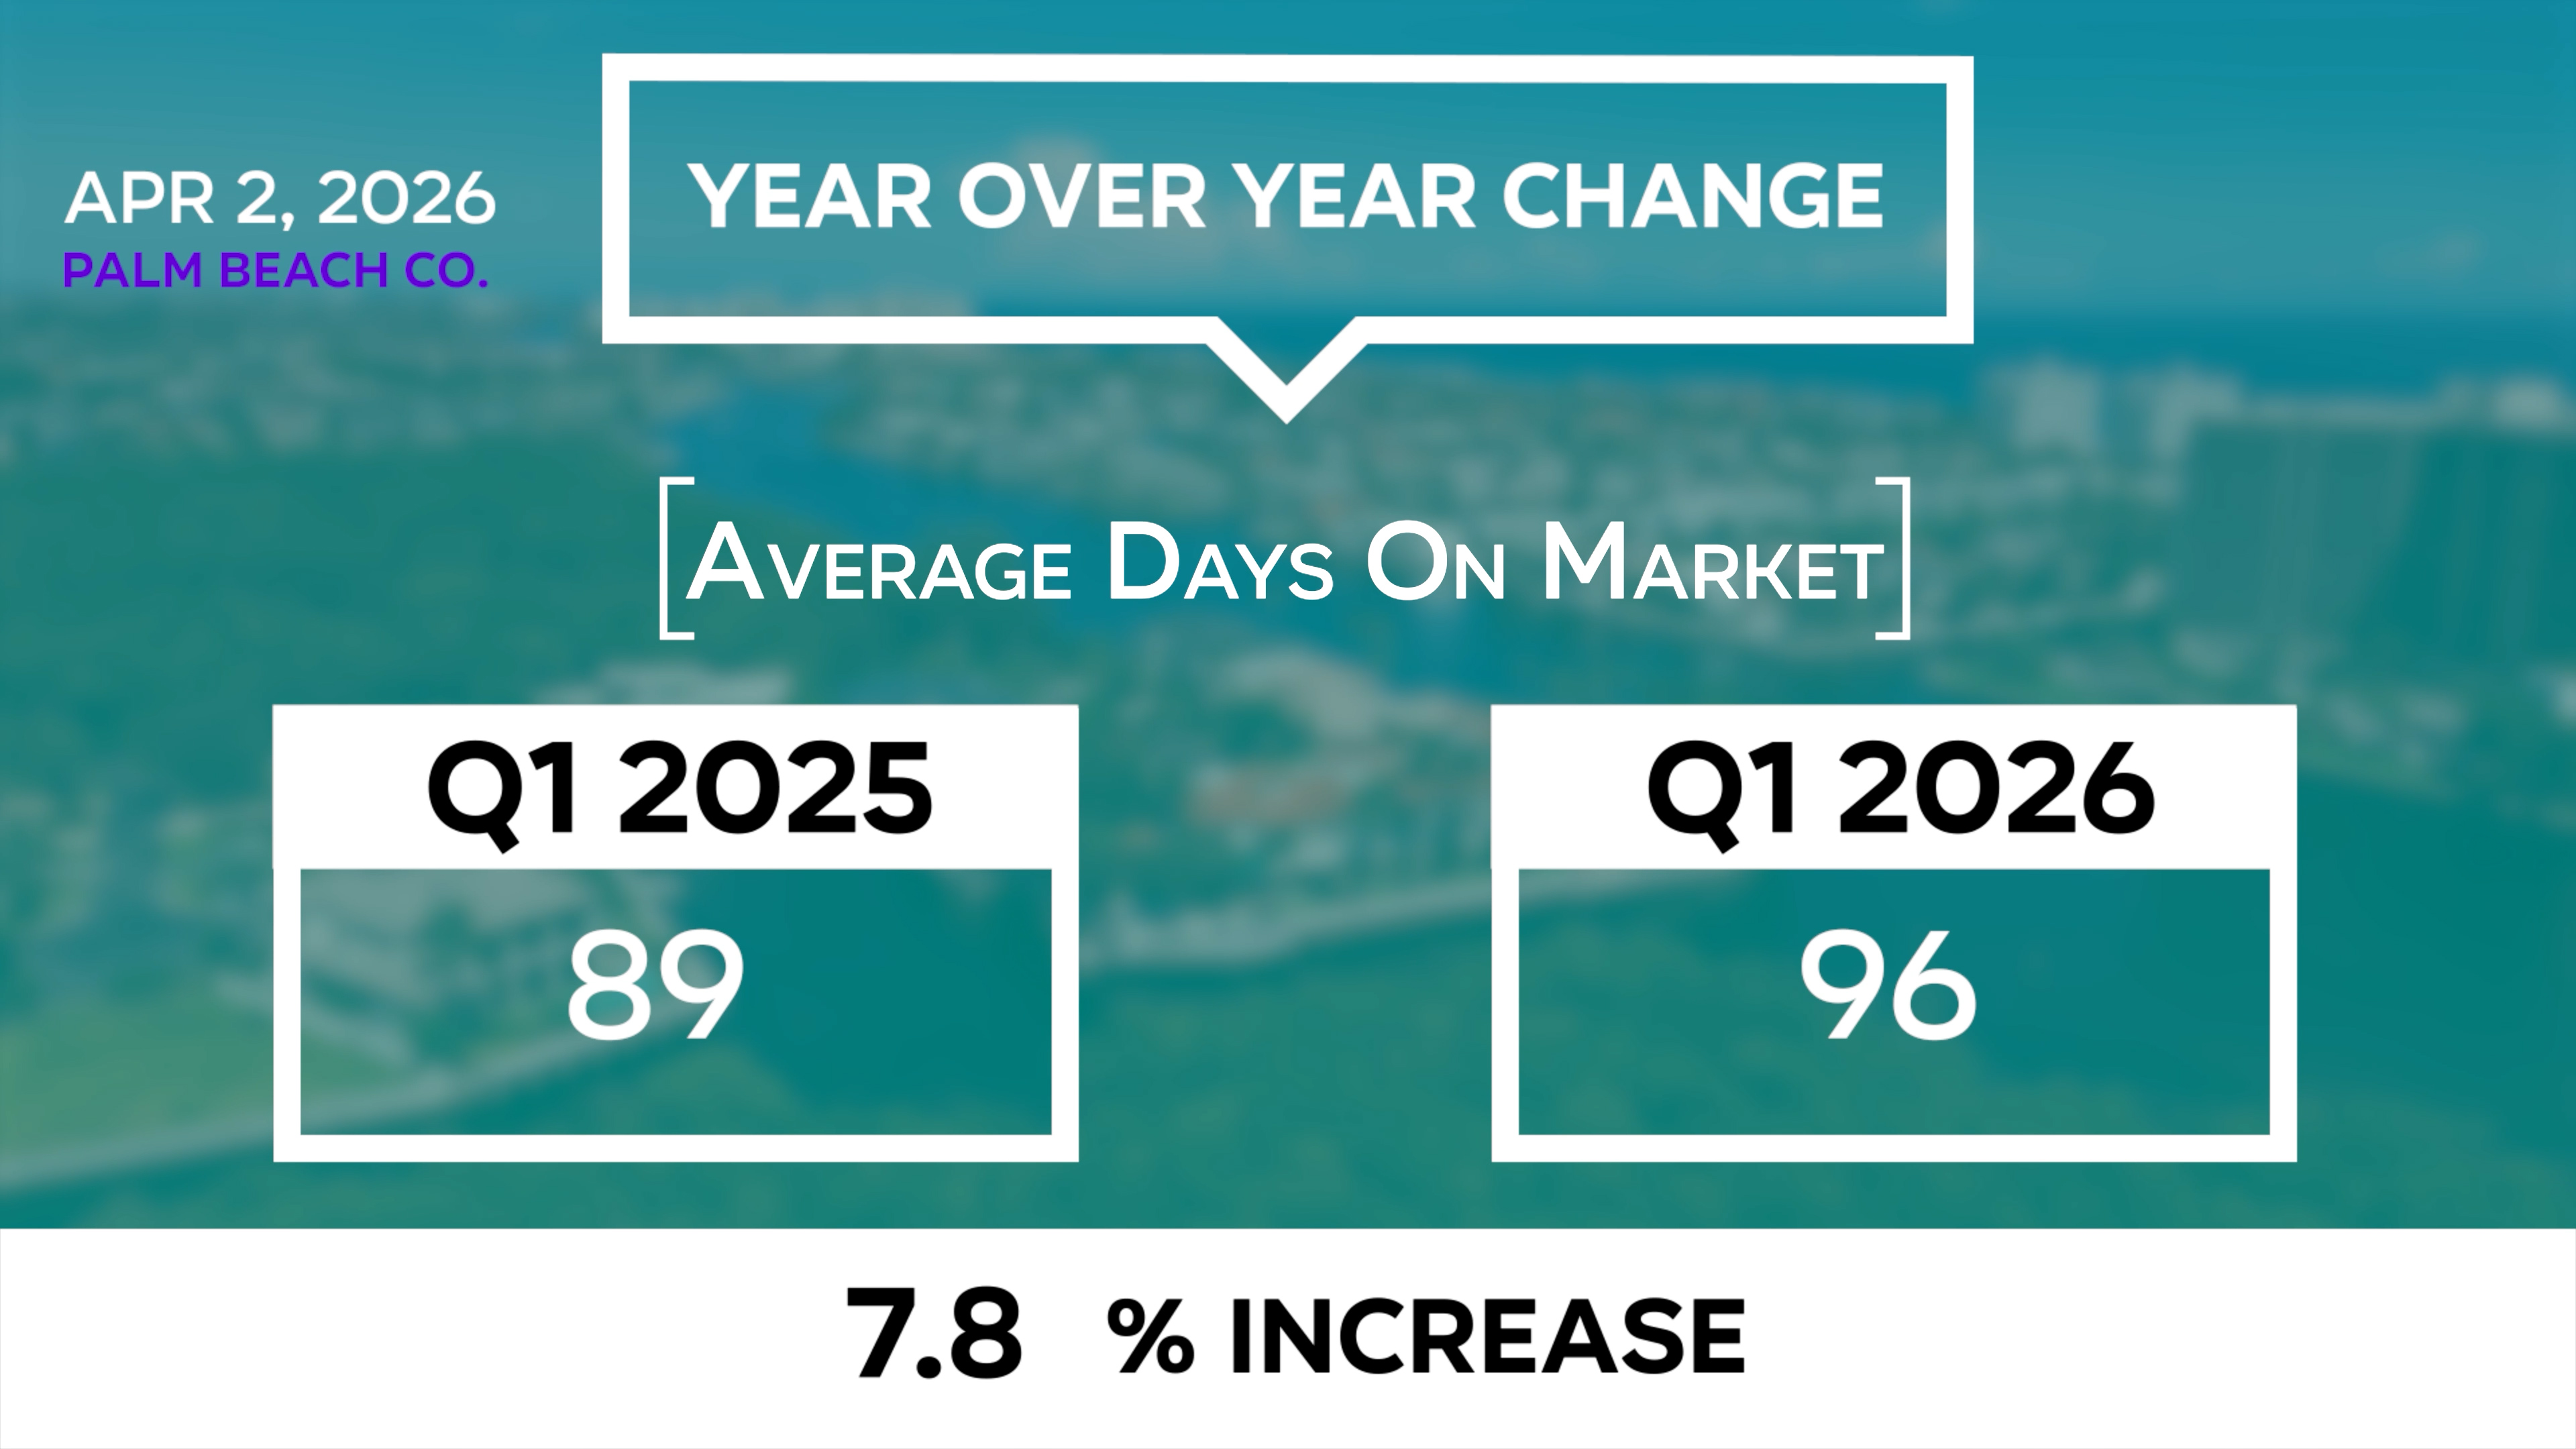
Days on market continues to climb, but the pace of that increase has moderated compared to what we saw in 2025. In Palm Beach County, the average days on market increased from 89 to 96 days year-to-date. That is an 8% increase. Broward saw a larger jump, from 89 to 100 days on average, a 12% increase.
The median numbers tell a similar story. Palm Beach went from 58 to 59 days (a 2% increase). Broward jumped from 61 to 64 days (a 5% increase). Homes are still taking longer to sell, but the dramatic year-over-year jumps we reported in 2025 have slowed considerably.
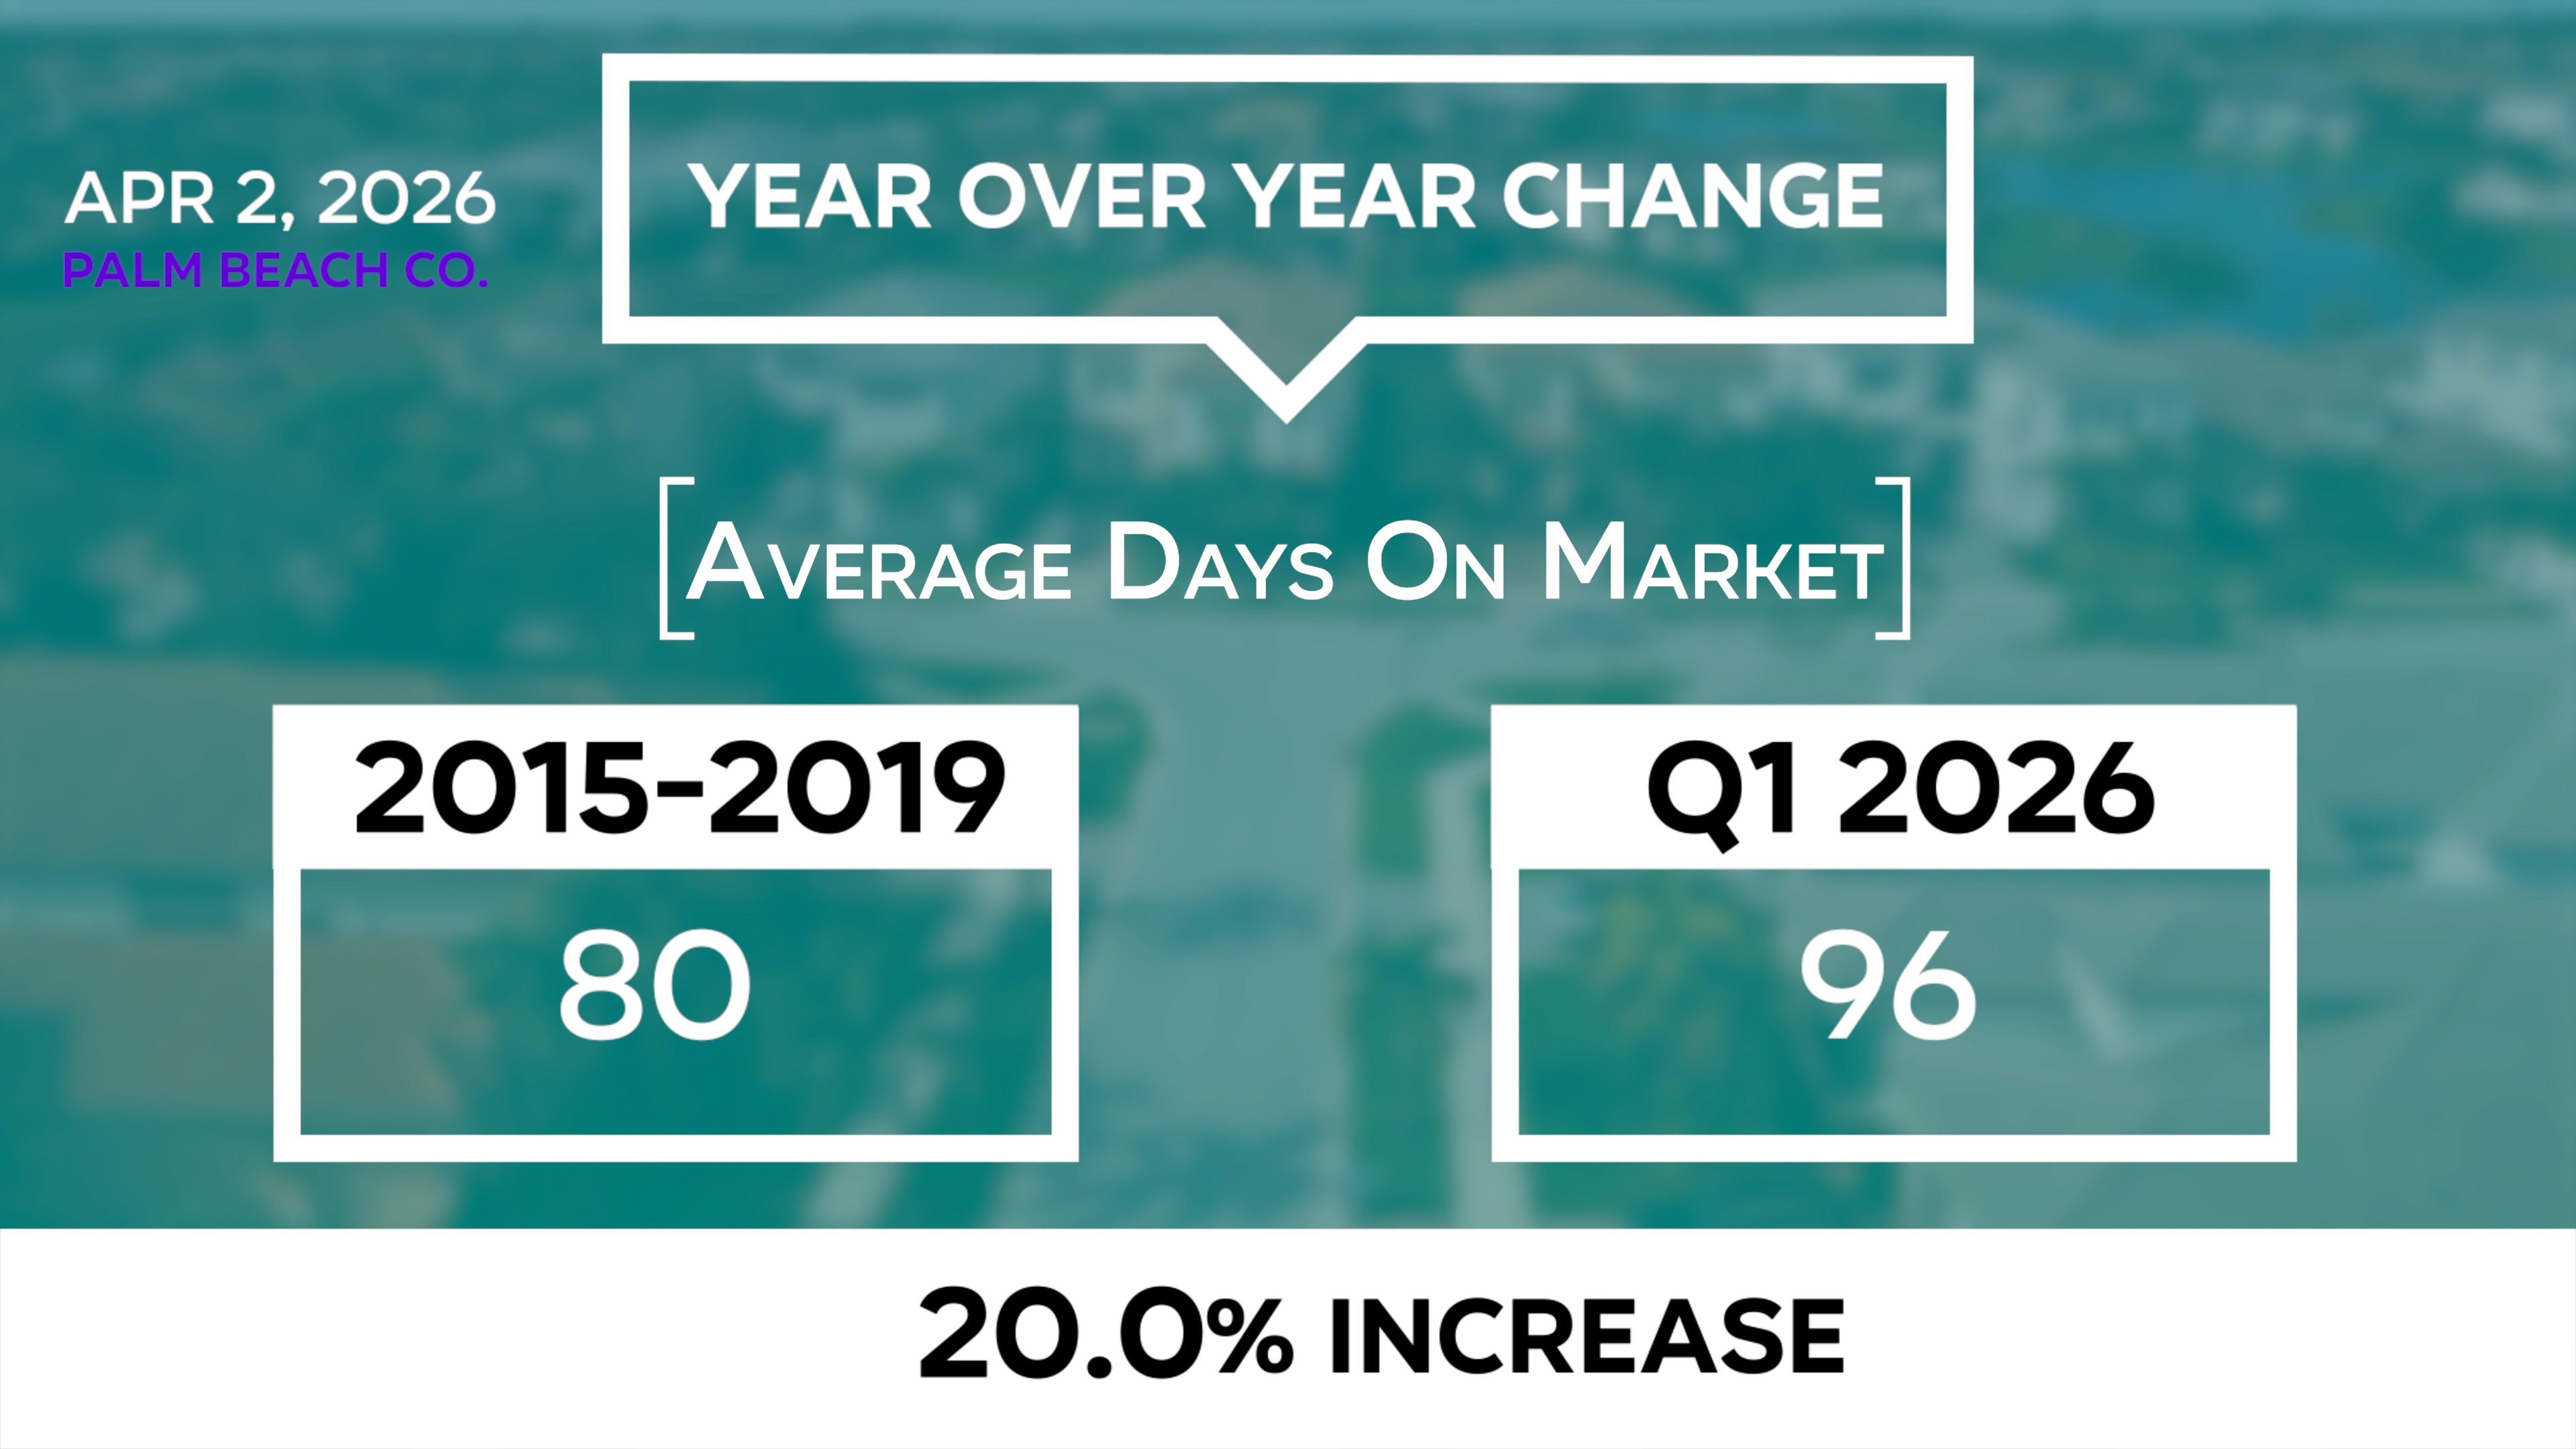
Before anyone panics, context matters here. An average of 96 to 100 days on market is not the end of the world. If you track historical data from 2015 to 2019, this was actually pretty normal. We are simply in a more balanced market compared to those pandemic years, albeit at the upper end of the historic norm.
Palm Beach prices surge while Broward shows mixed signals
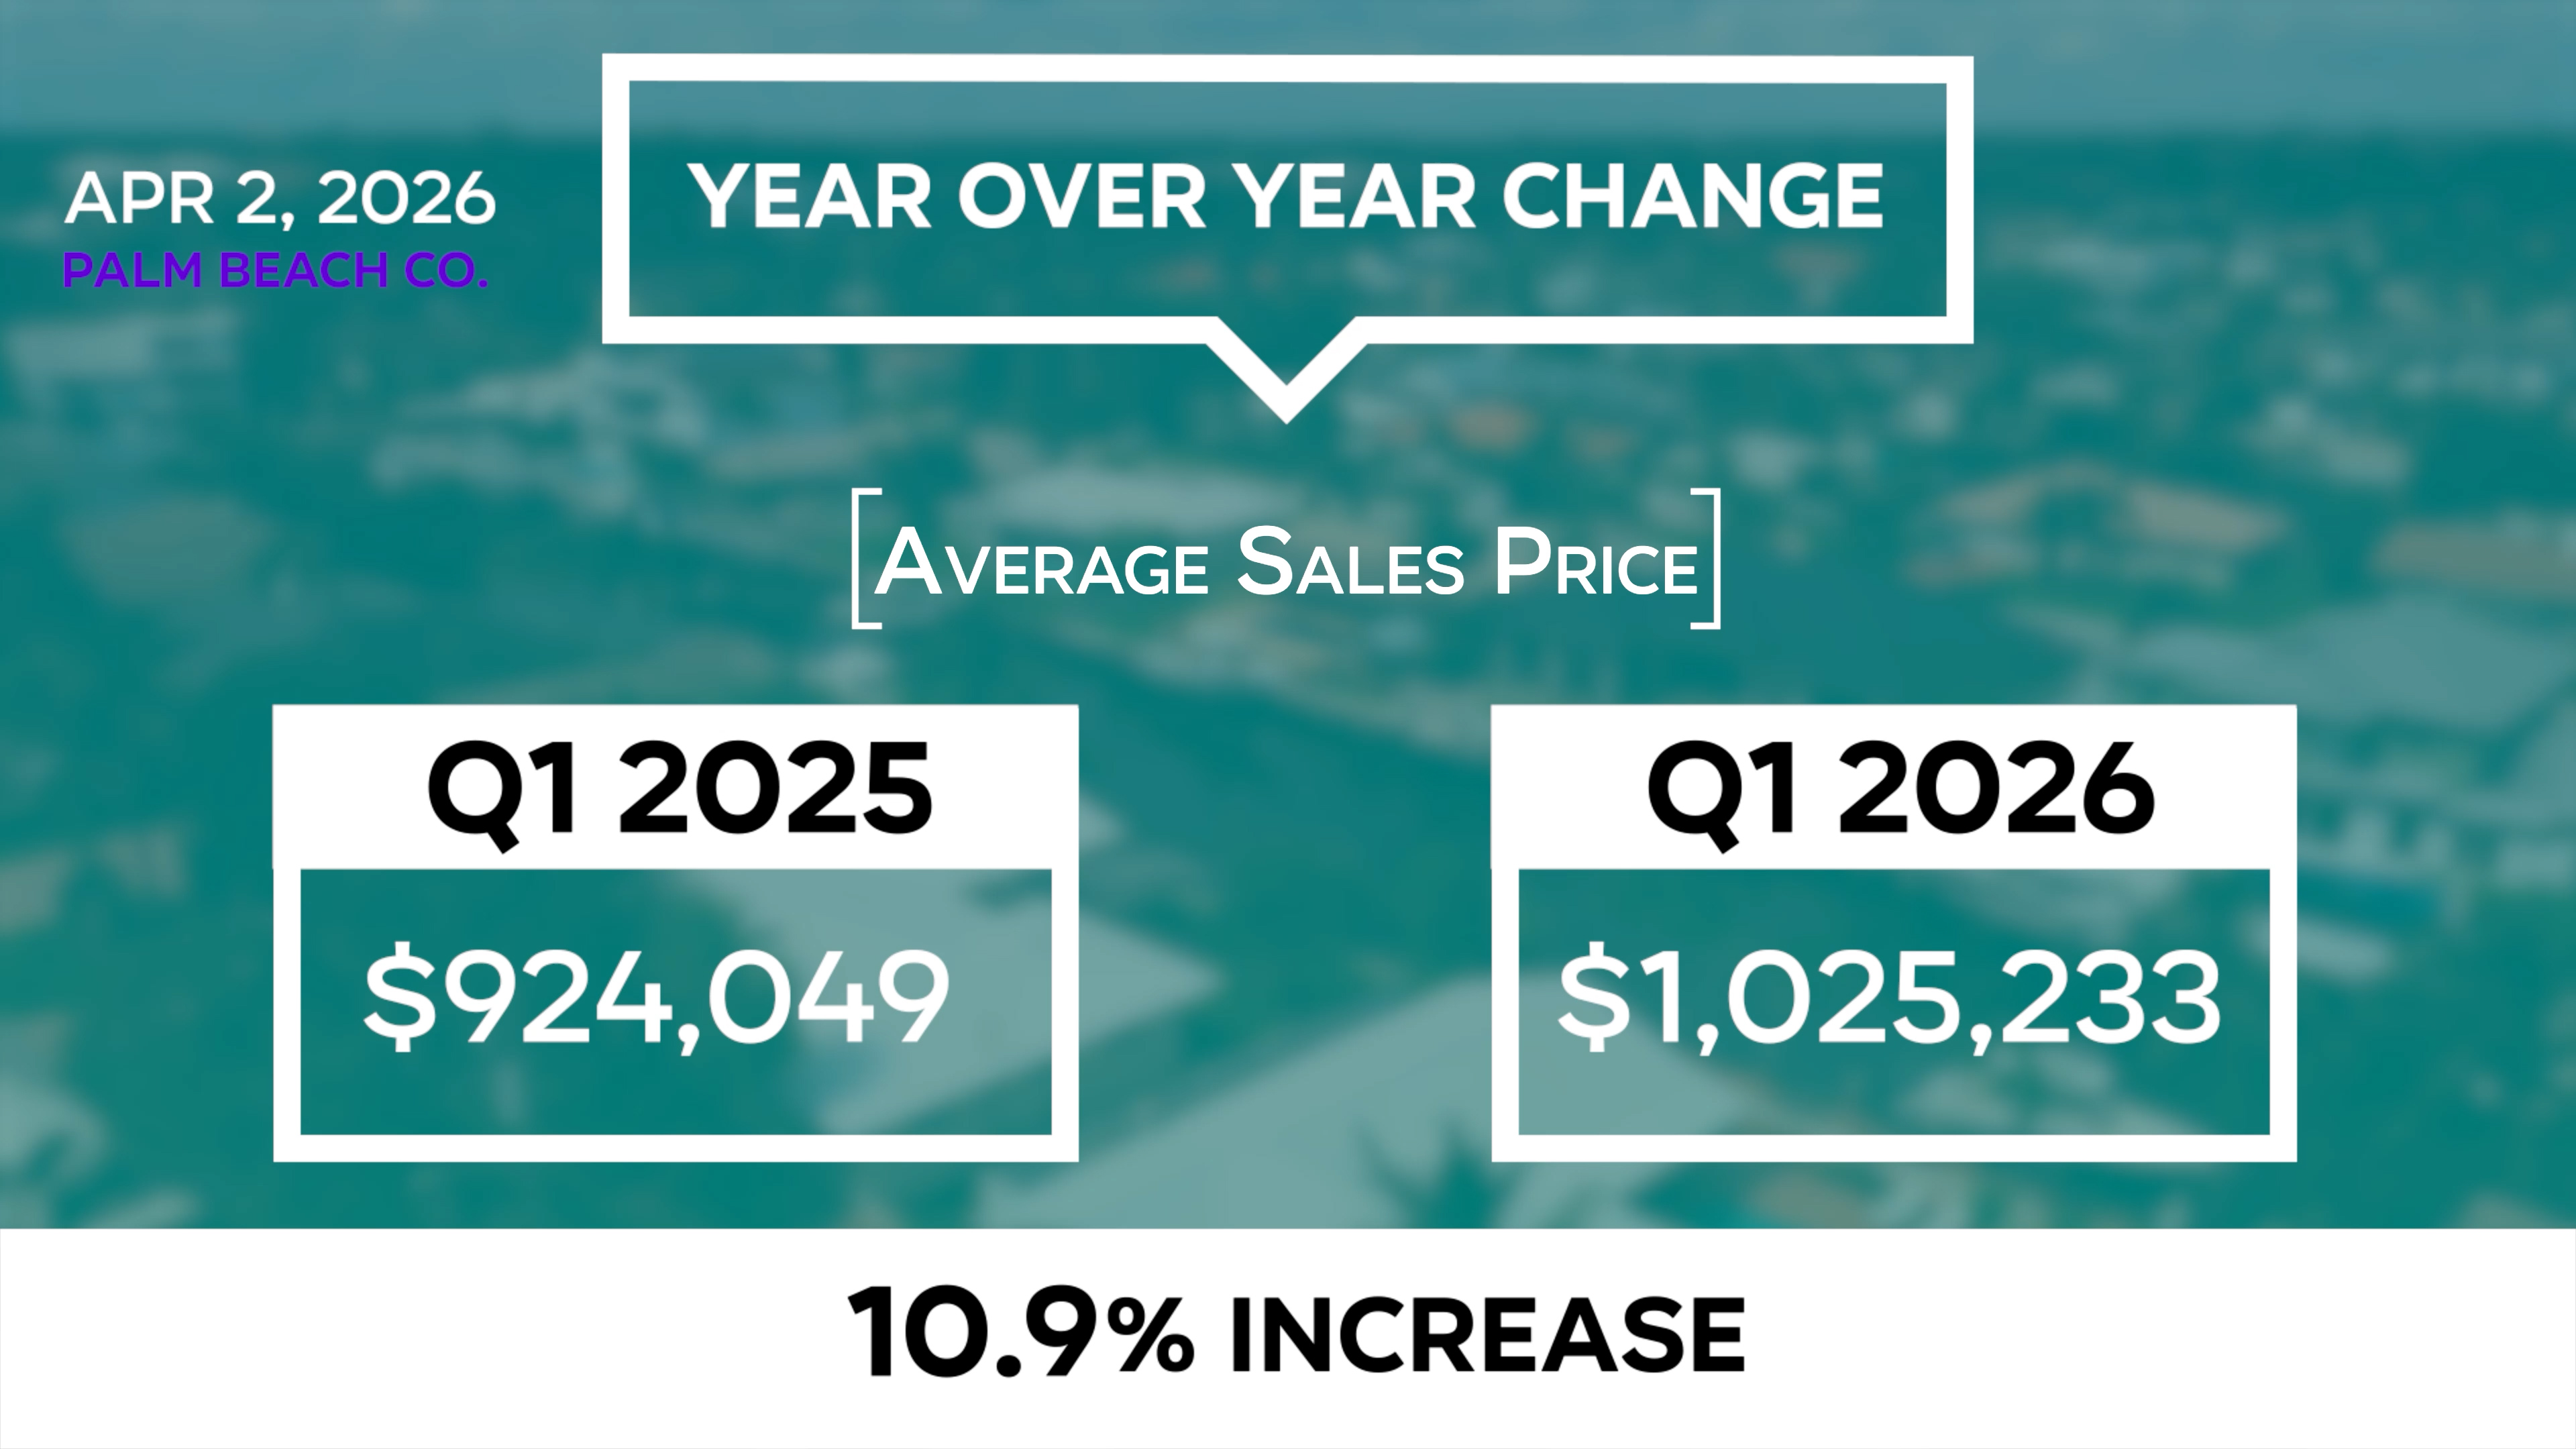
This is where the two markets start telling very different stories. Palm Beach County saw the average sale price climb 11% year-to-date, going from $924,000 to just over $1,025,000. The median sale price is up 3%, from $505,000 to $518,500. That is solid price appreciation across the board.
Broward County? The average sale price is up 32% year-to-date, from $610,000 to $807,000. Before you get too excited, let me explain. That number is skewed by high-end sales. There were 56 more sales above $1.5M in Q1 2026 compared to Q1 2025, and most of those were over $5M. The luxury market is booming while the typical buyer's market is softening.
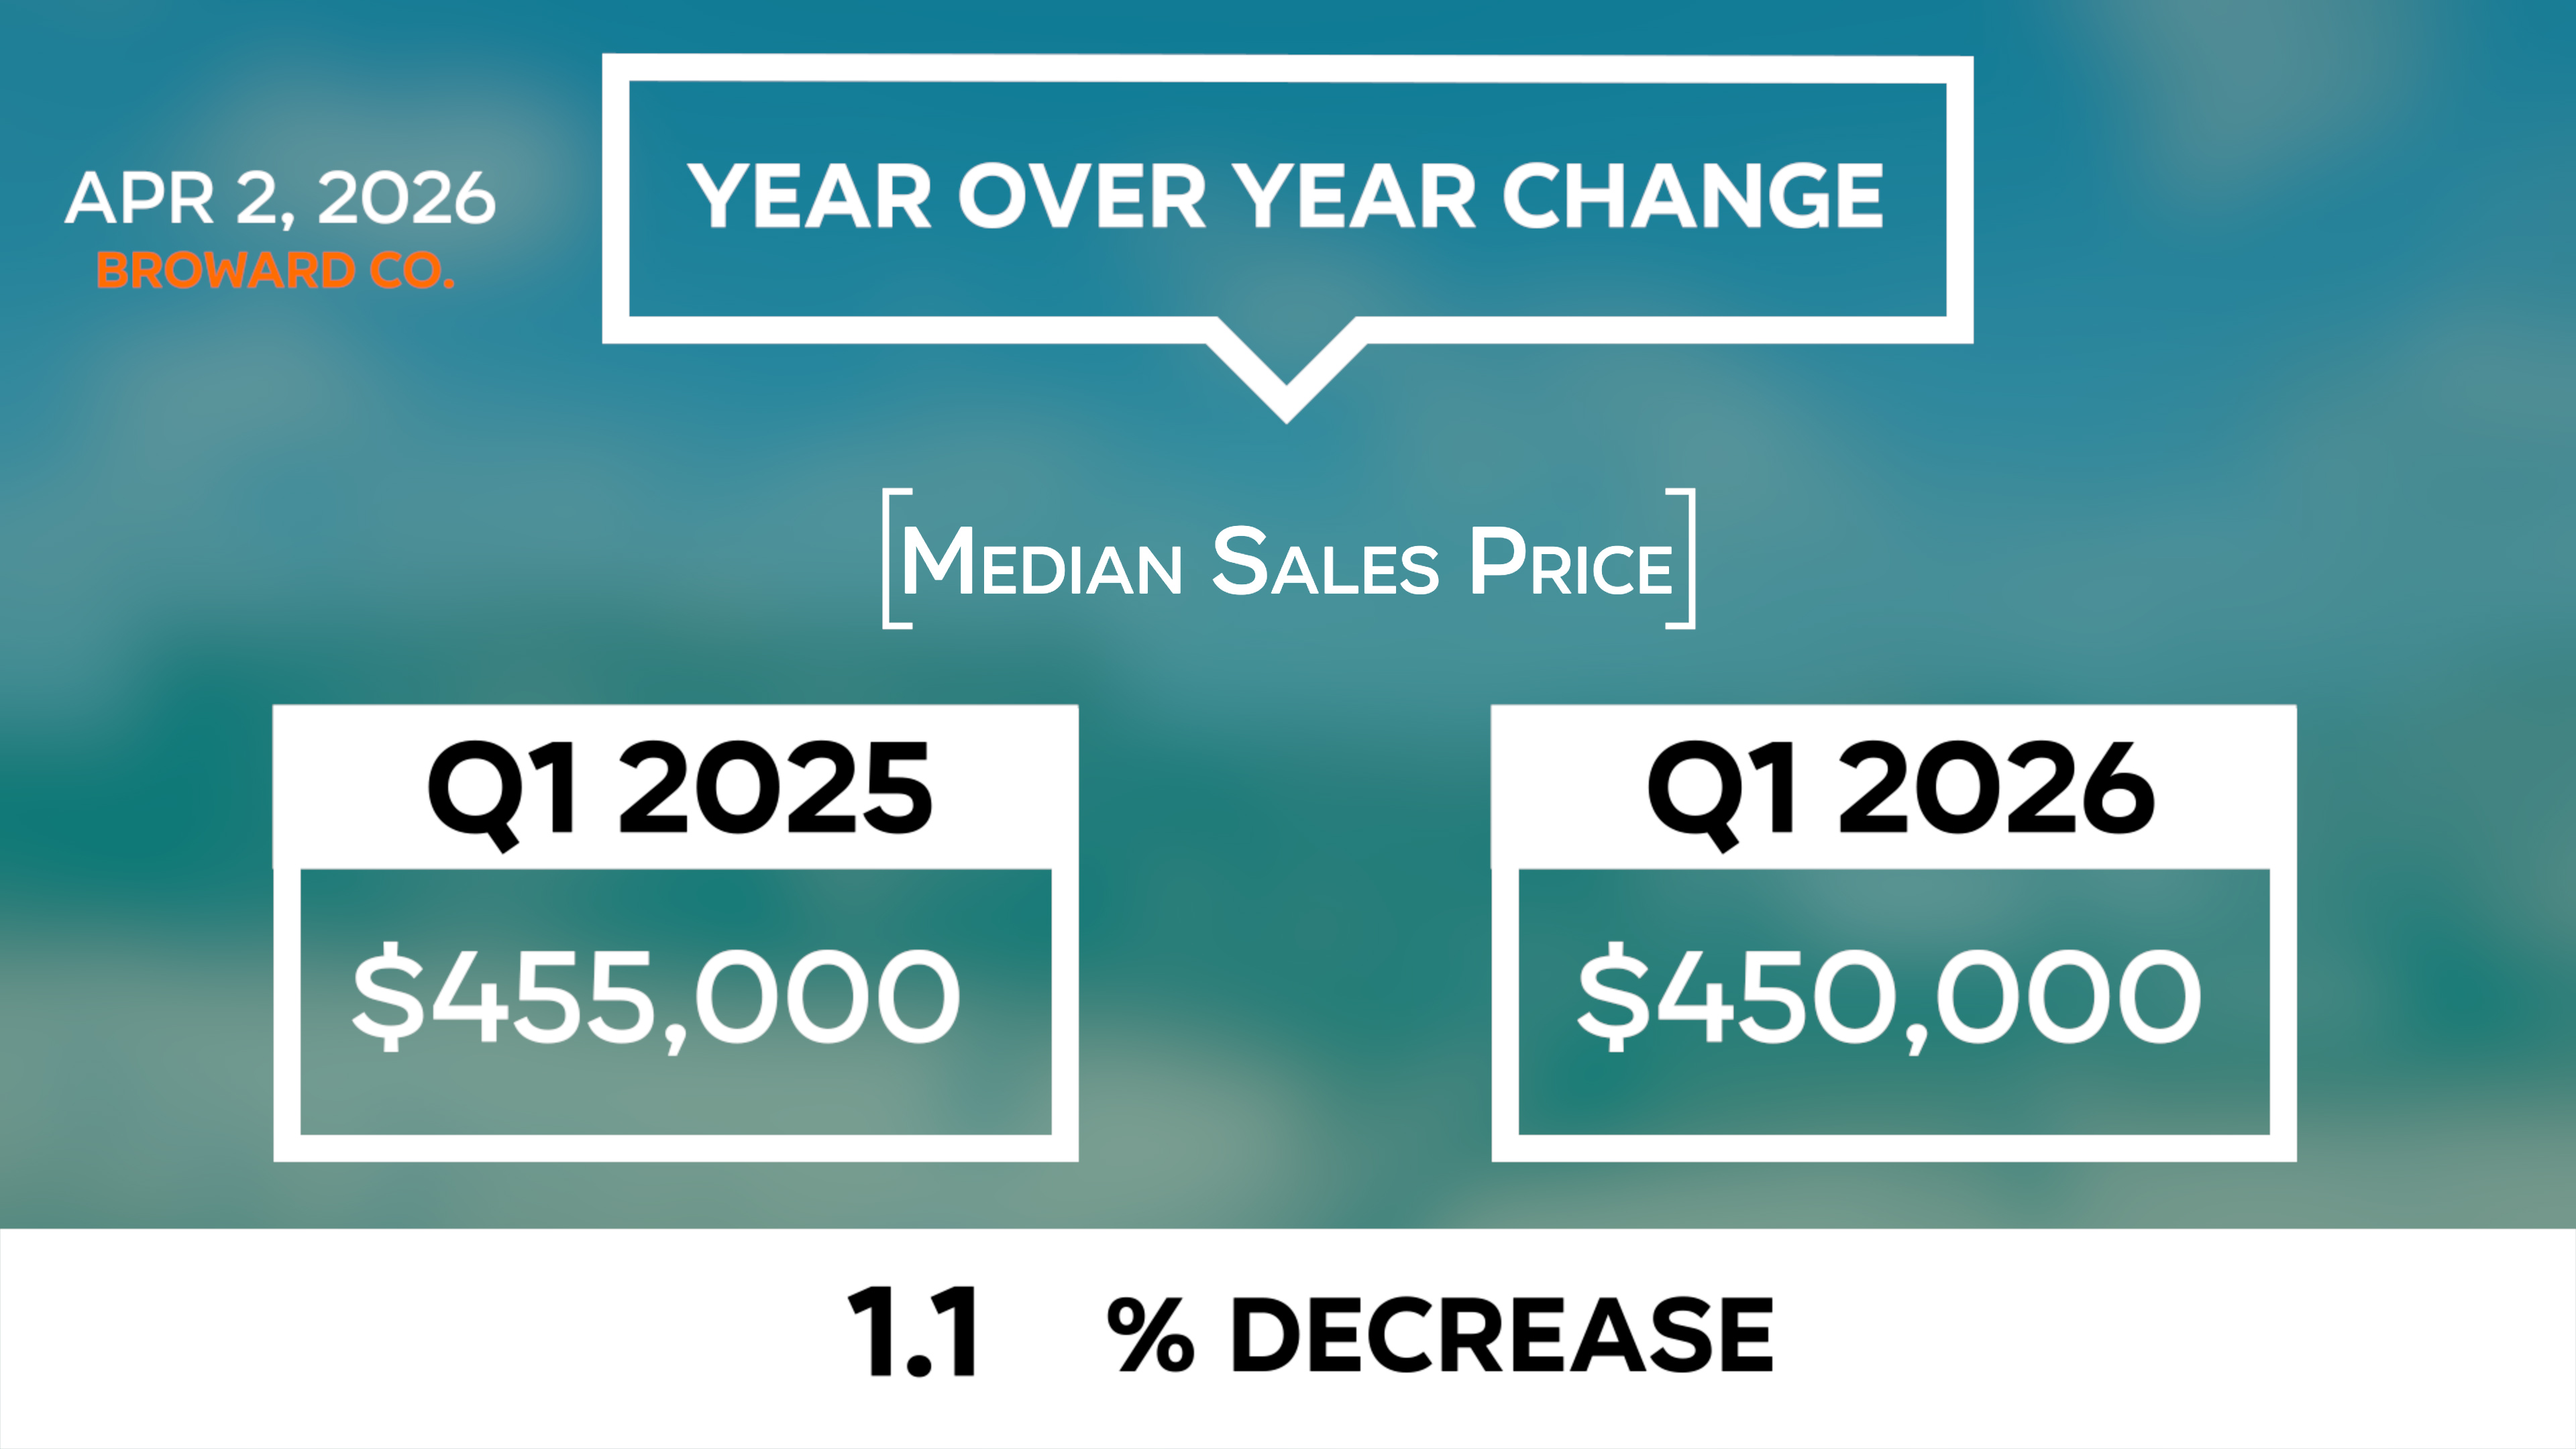
When we look at the median sale price in Broward, it is actually down 1%, from $455,000 to $450,000. The typical home in Broward is selling for about the same or slightly less than Q1 2025. Palm Beach is showing healthy price appreciation at all levels. Broward is essentially flat when you look past the luxury outliers.
Inventory is finally declining in both counties
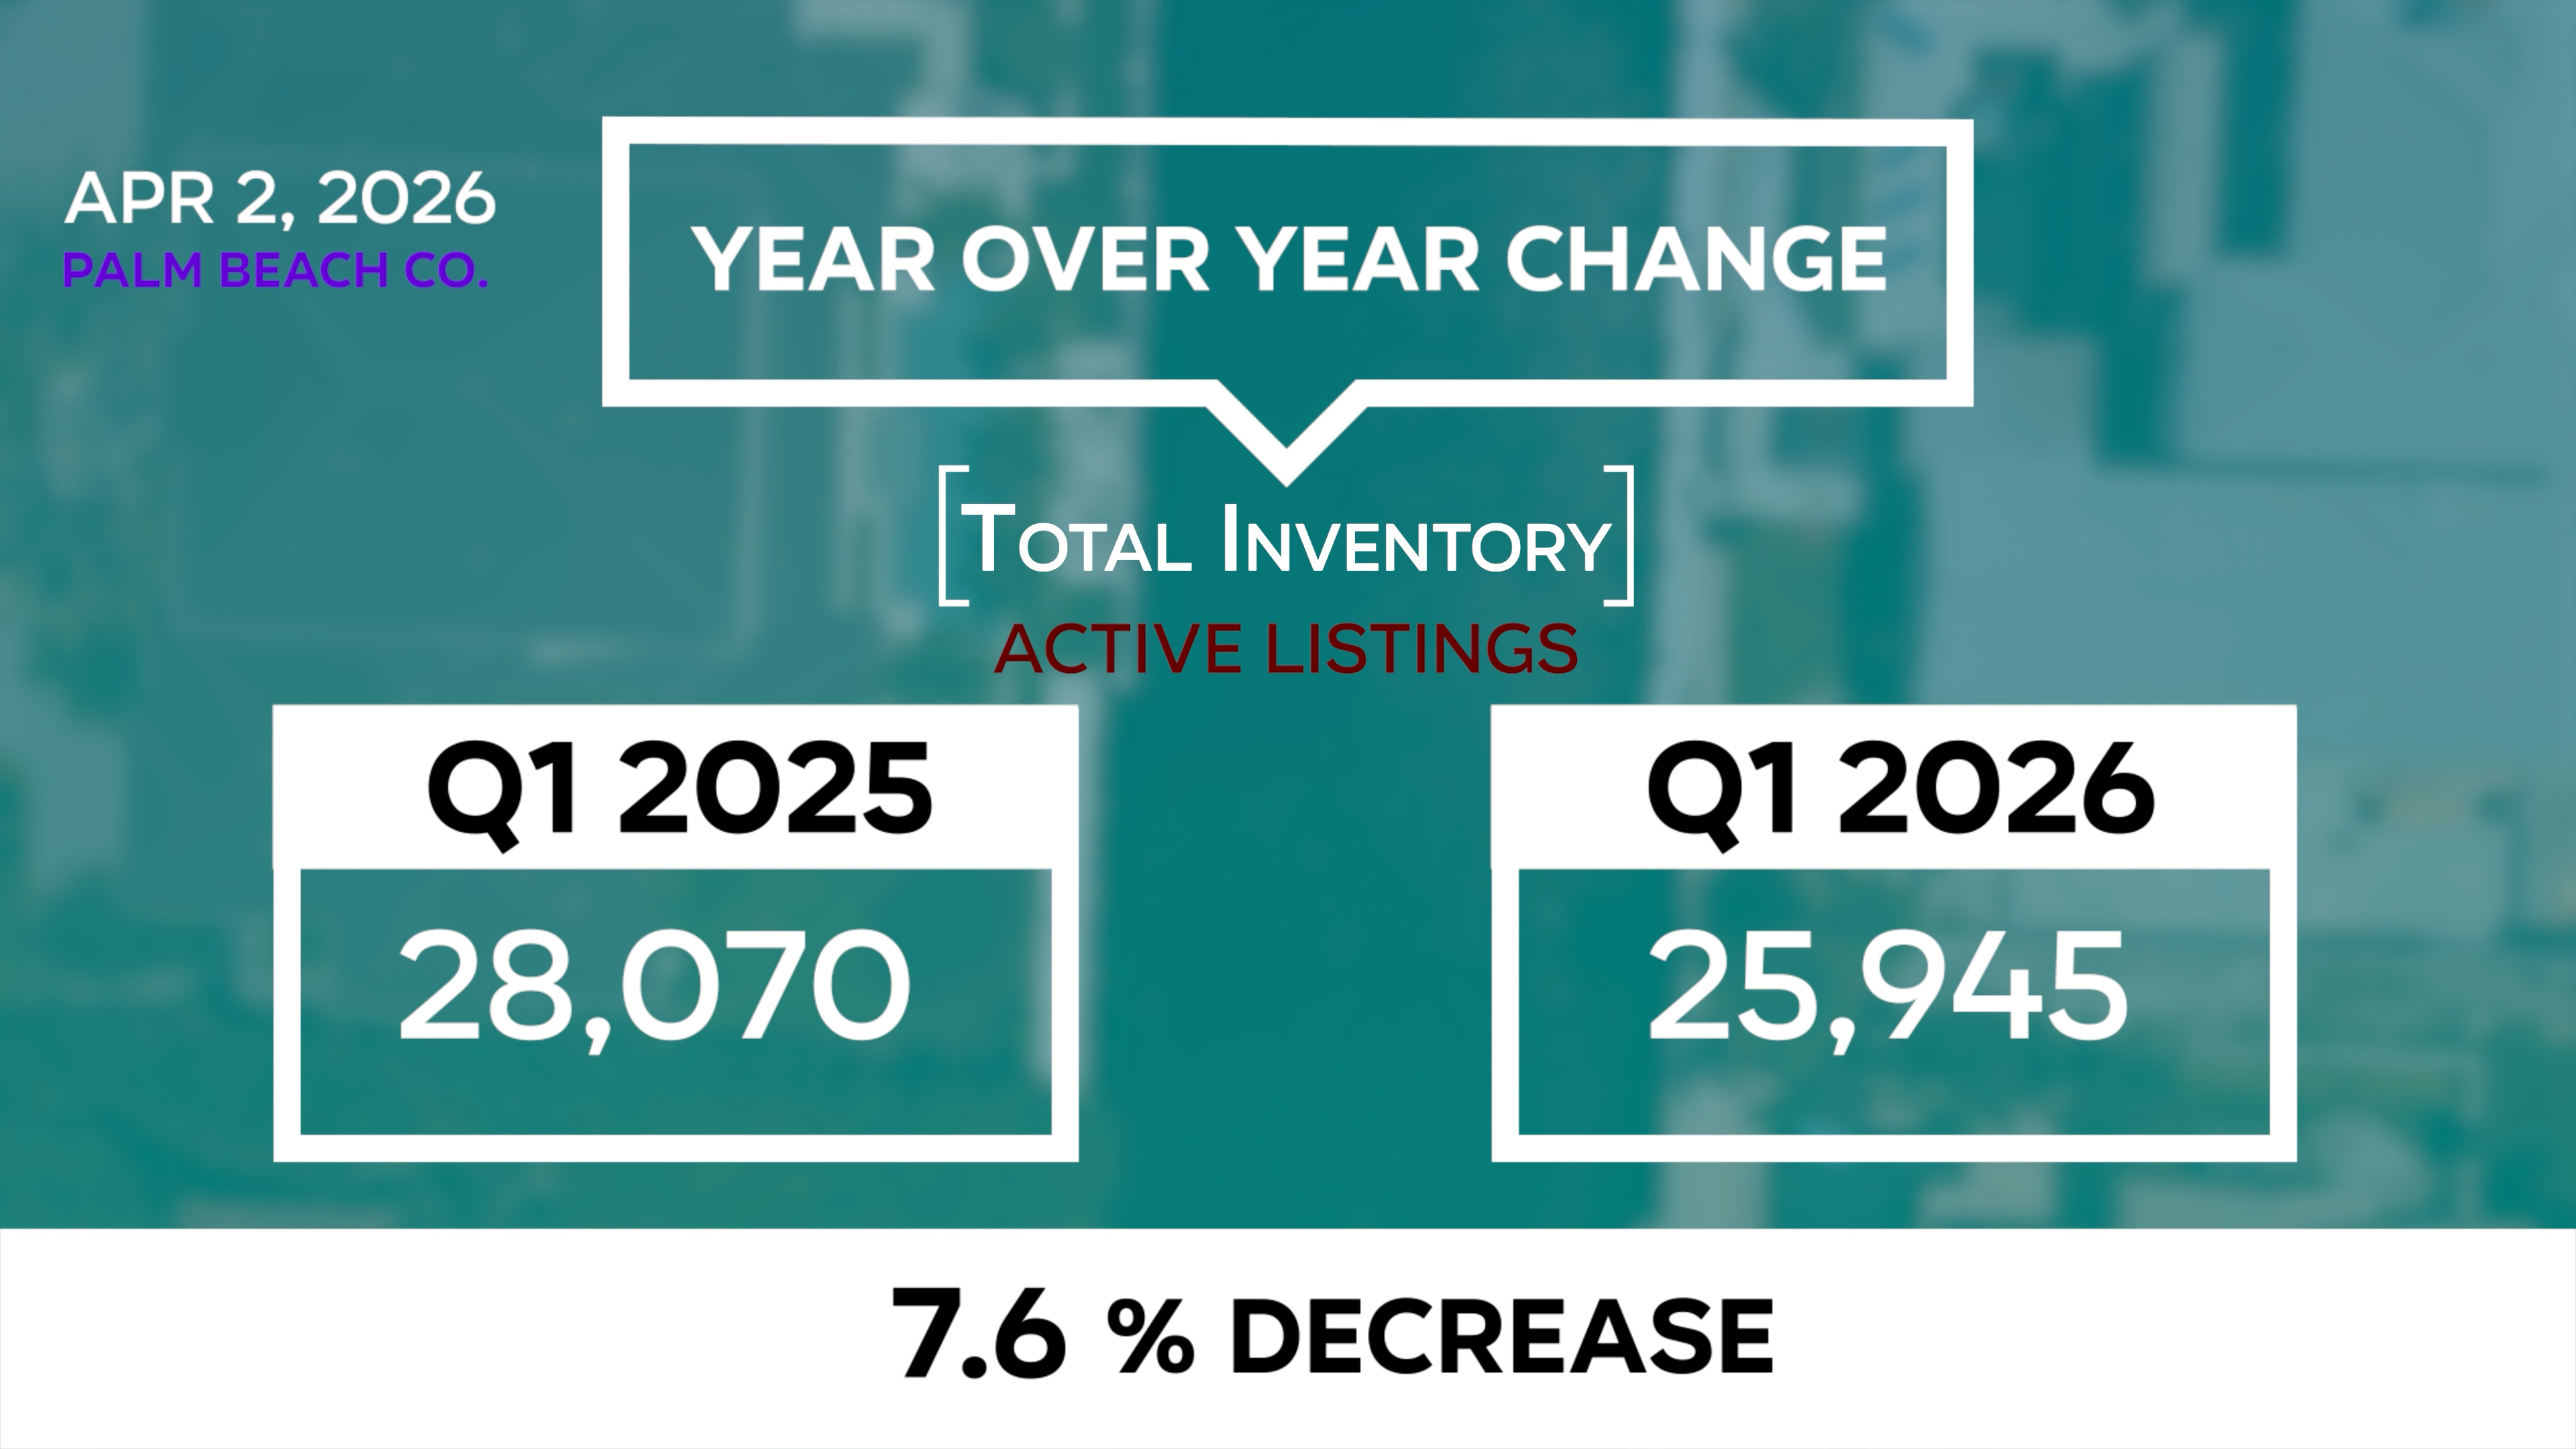
Here is the big shift from 2025: inventory is actually declining in both counties. Palm Beach County inventory is down 8% in Q1 2026, from about 28,000 homes in Q1 2025 to just under 26,000. Broward is down 7%, from 32,700 in Q1 2025 to 30,300 in Q1 2026.
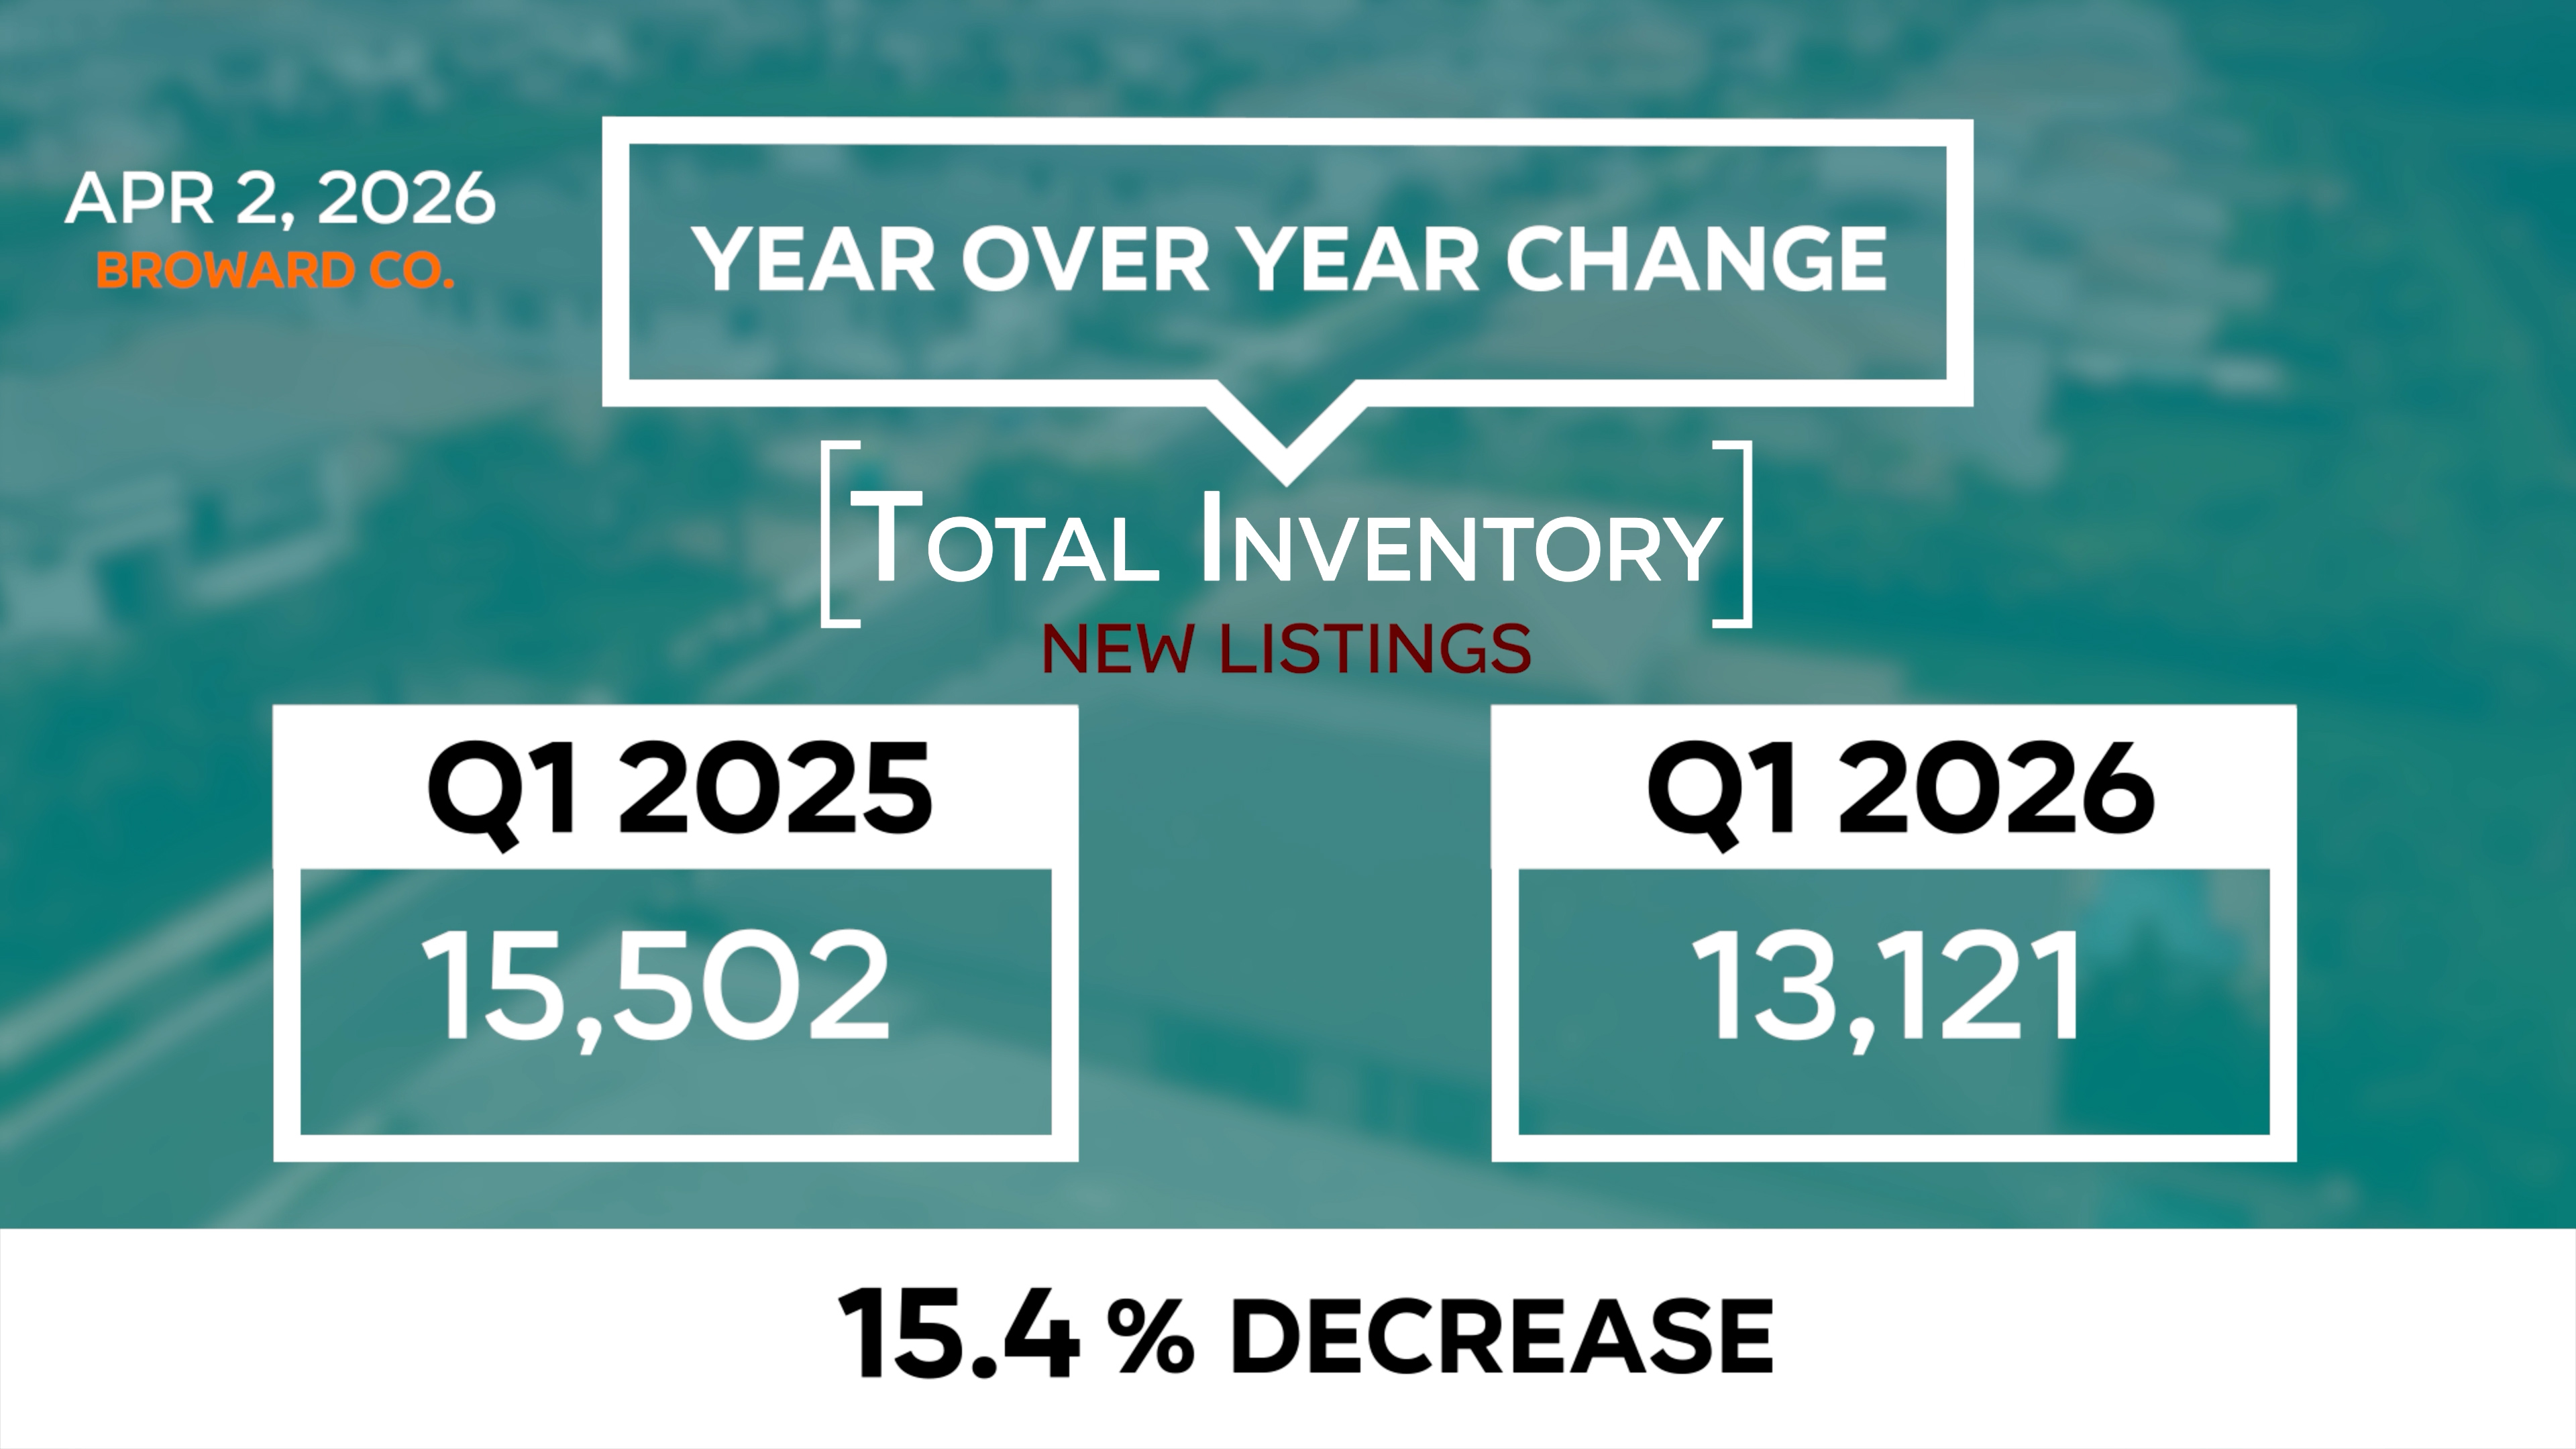
And new listings are down significantly. Palm Beach saw an 11% decrease in new listings year-to-date. Broward was down 15%. Fewer homes are coming to market. For context, Palm Beach and Broward County are now sitting 3% above 2016 to 2019 average inventory levels. We still have more inventory on average than the pre-pandemic period, but the trend has reversed. We are no longer accumulating inventory. We are working through it.
This is a significant shift from what we saw in 2025. Back in our January 2026 market report, inventory was still climbing. Now it is declining. The supply squeeze is real, and it is happening in both counties.
Sales volume continues to diverge between counties
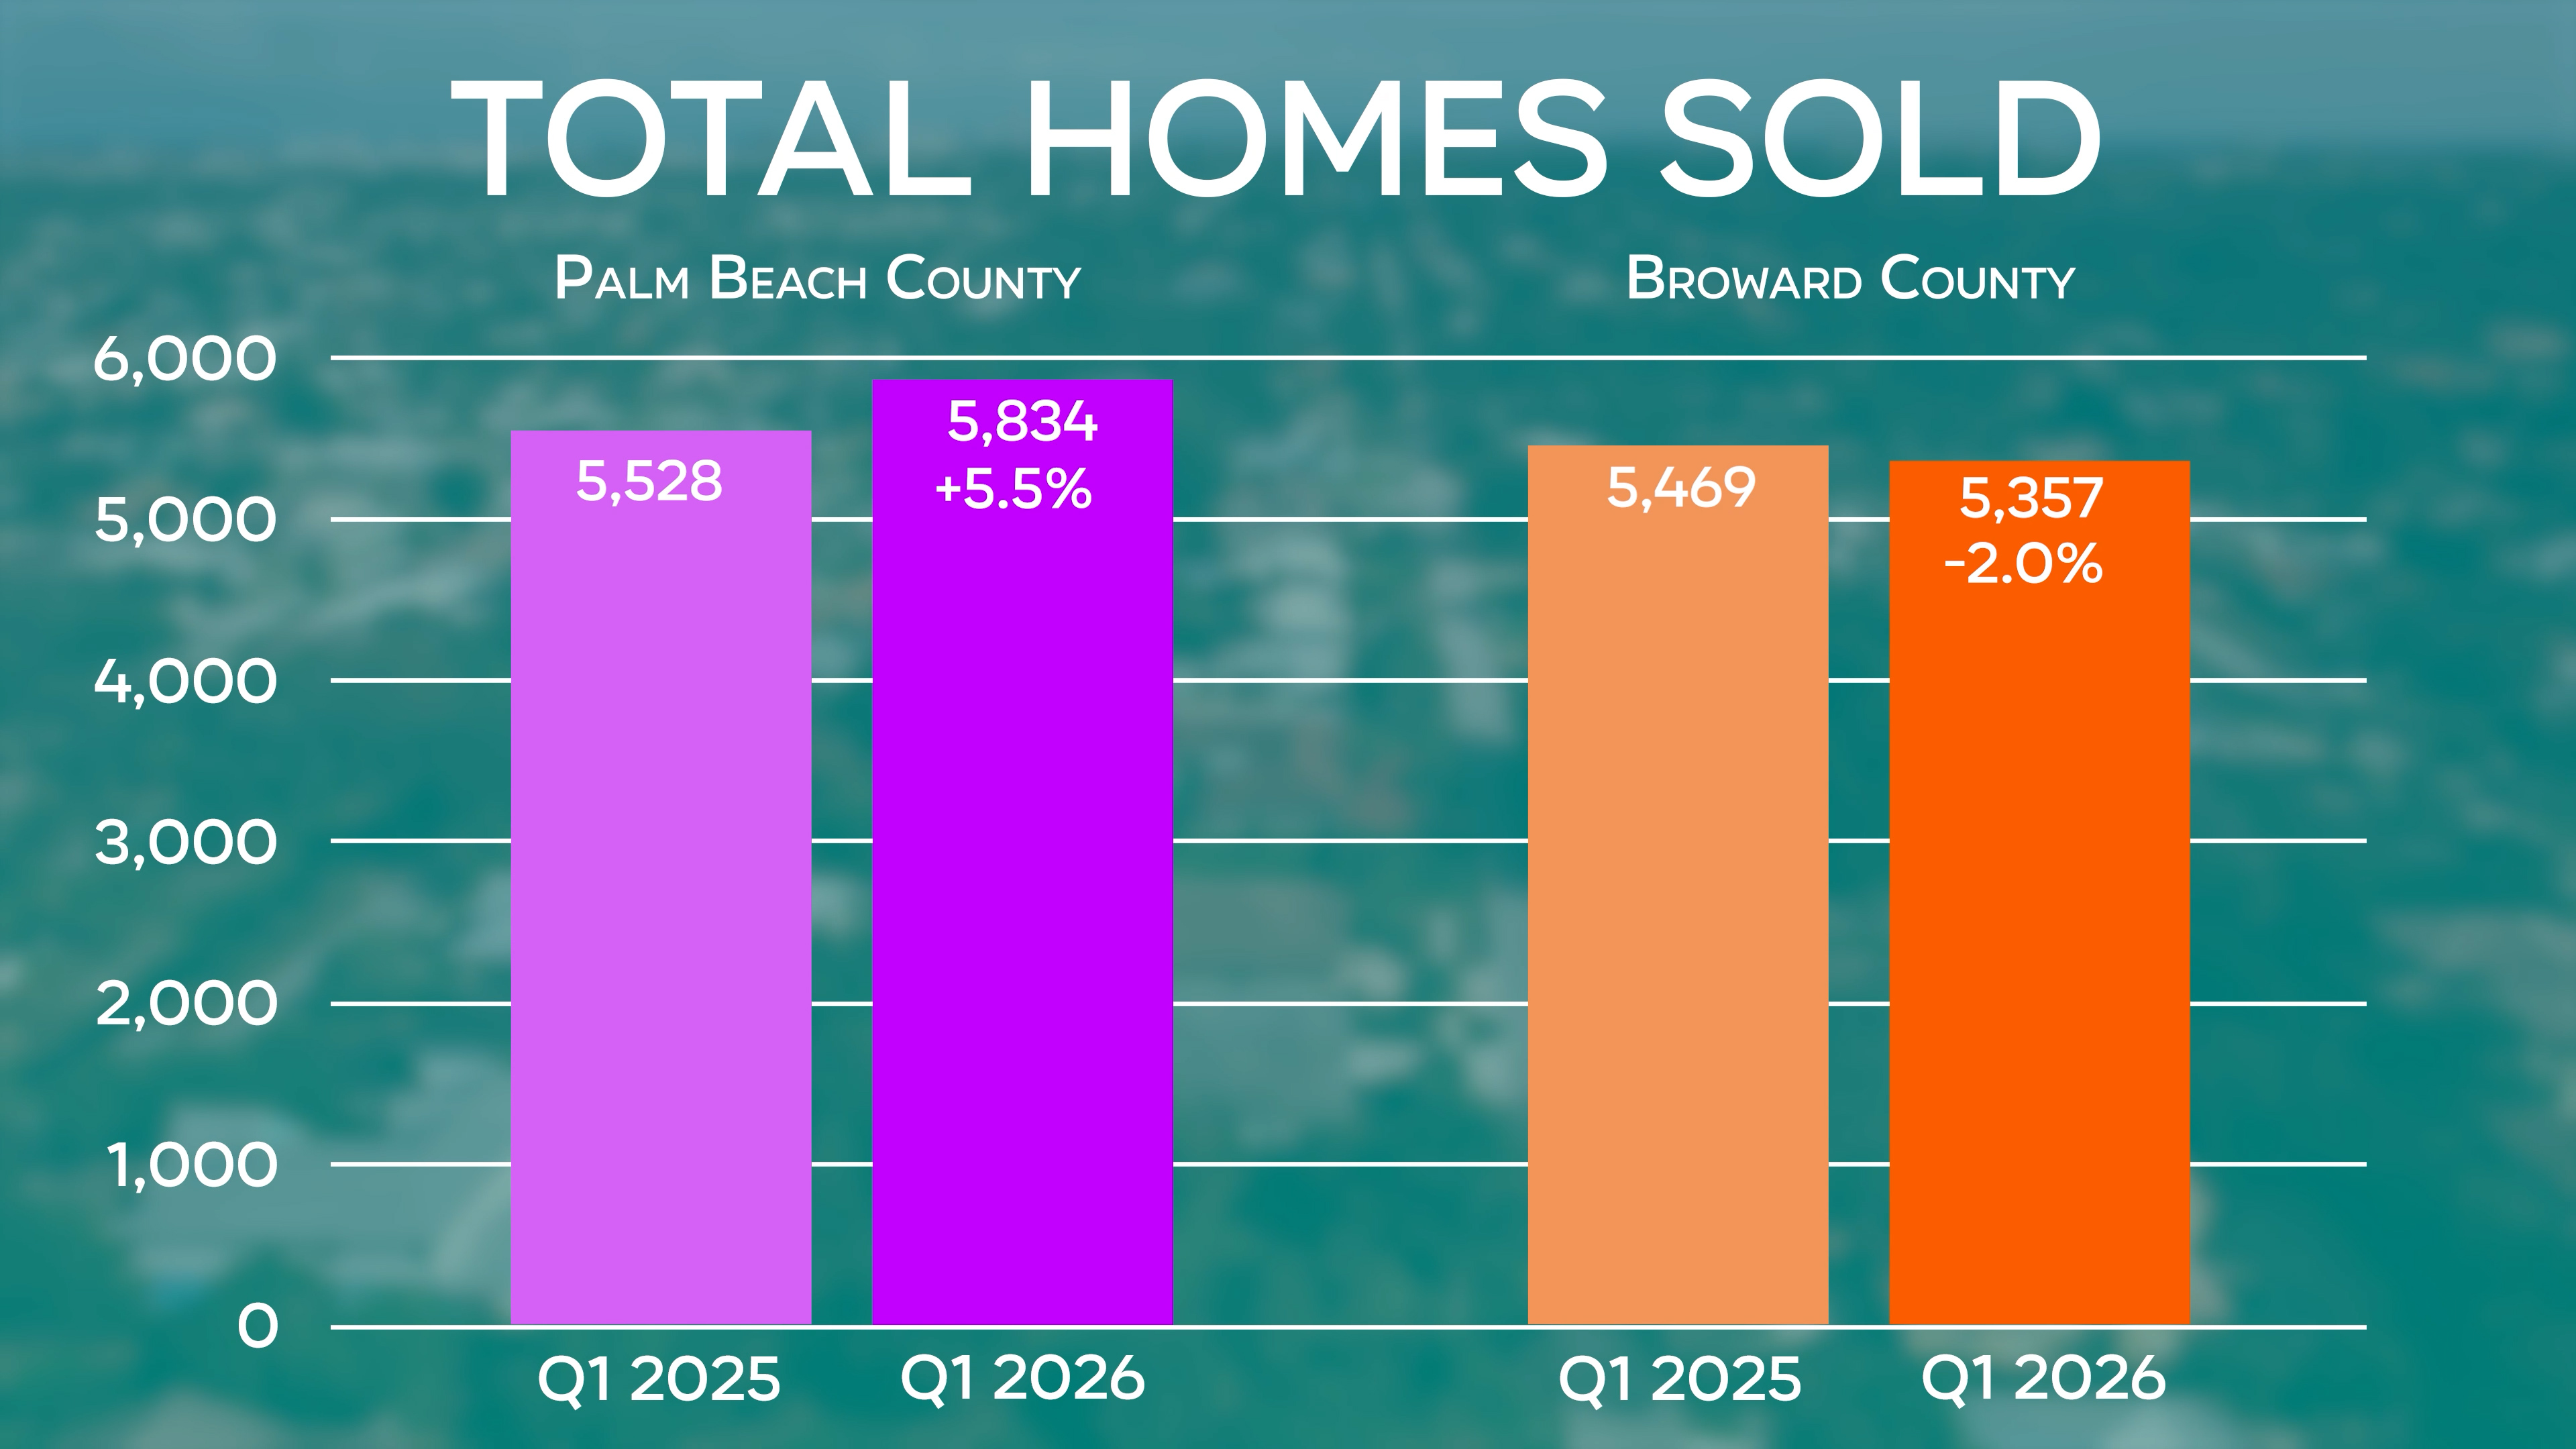
Here is where Palm Beach and Broward really separate. Palm Beach County saw sold homes up 6% year-to-date, from 5,528 to 5,834. And under-contract activity is up 11%. That is strong momentum. Meanwhile, Broward County's sold homes are down 2% year-to-date, from 5,469 to 5,357. However, under-contract activity is up 9%, so there are signs of life.
What does this tell us? Palm Beach is selling more homes with less inventory. That is a recipe for a strengthening market. Broward is still slightly contracting, but the under-contract numbers suggest improvement ahead.
Sales volume is the lifeblood of any real estate market. Palm Beach is growing. Broward is stabilizing. That 8-point swing between the two counties (Palm Beach up 6%, Broward down 2%) is significant. Overall though, Q1 was healthy for both counties. No major red flags here.
Absorption rates improved across the board
The absorption rate measures how long current inventory would last at the current pace of sales. A 5 to 6 month absorption rate typically signals a balanced market. Below 5 months favors sellers. Above 6 months favors buyers. Here is where the story gets really interesting.
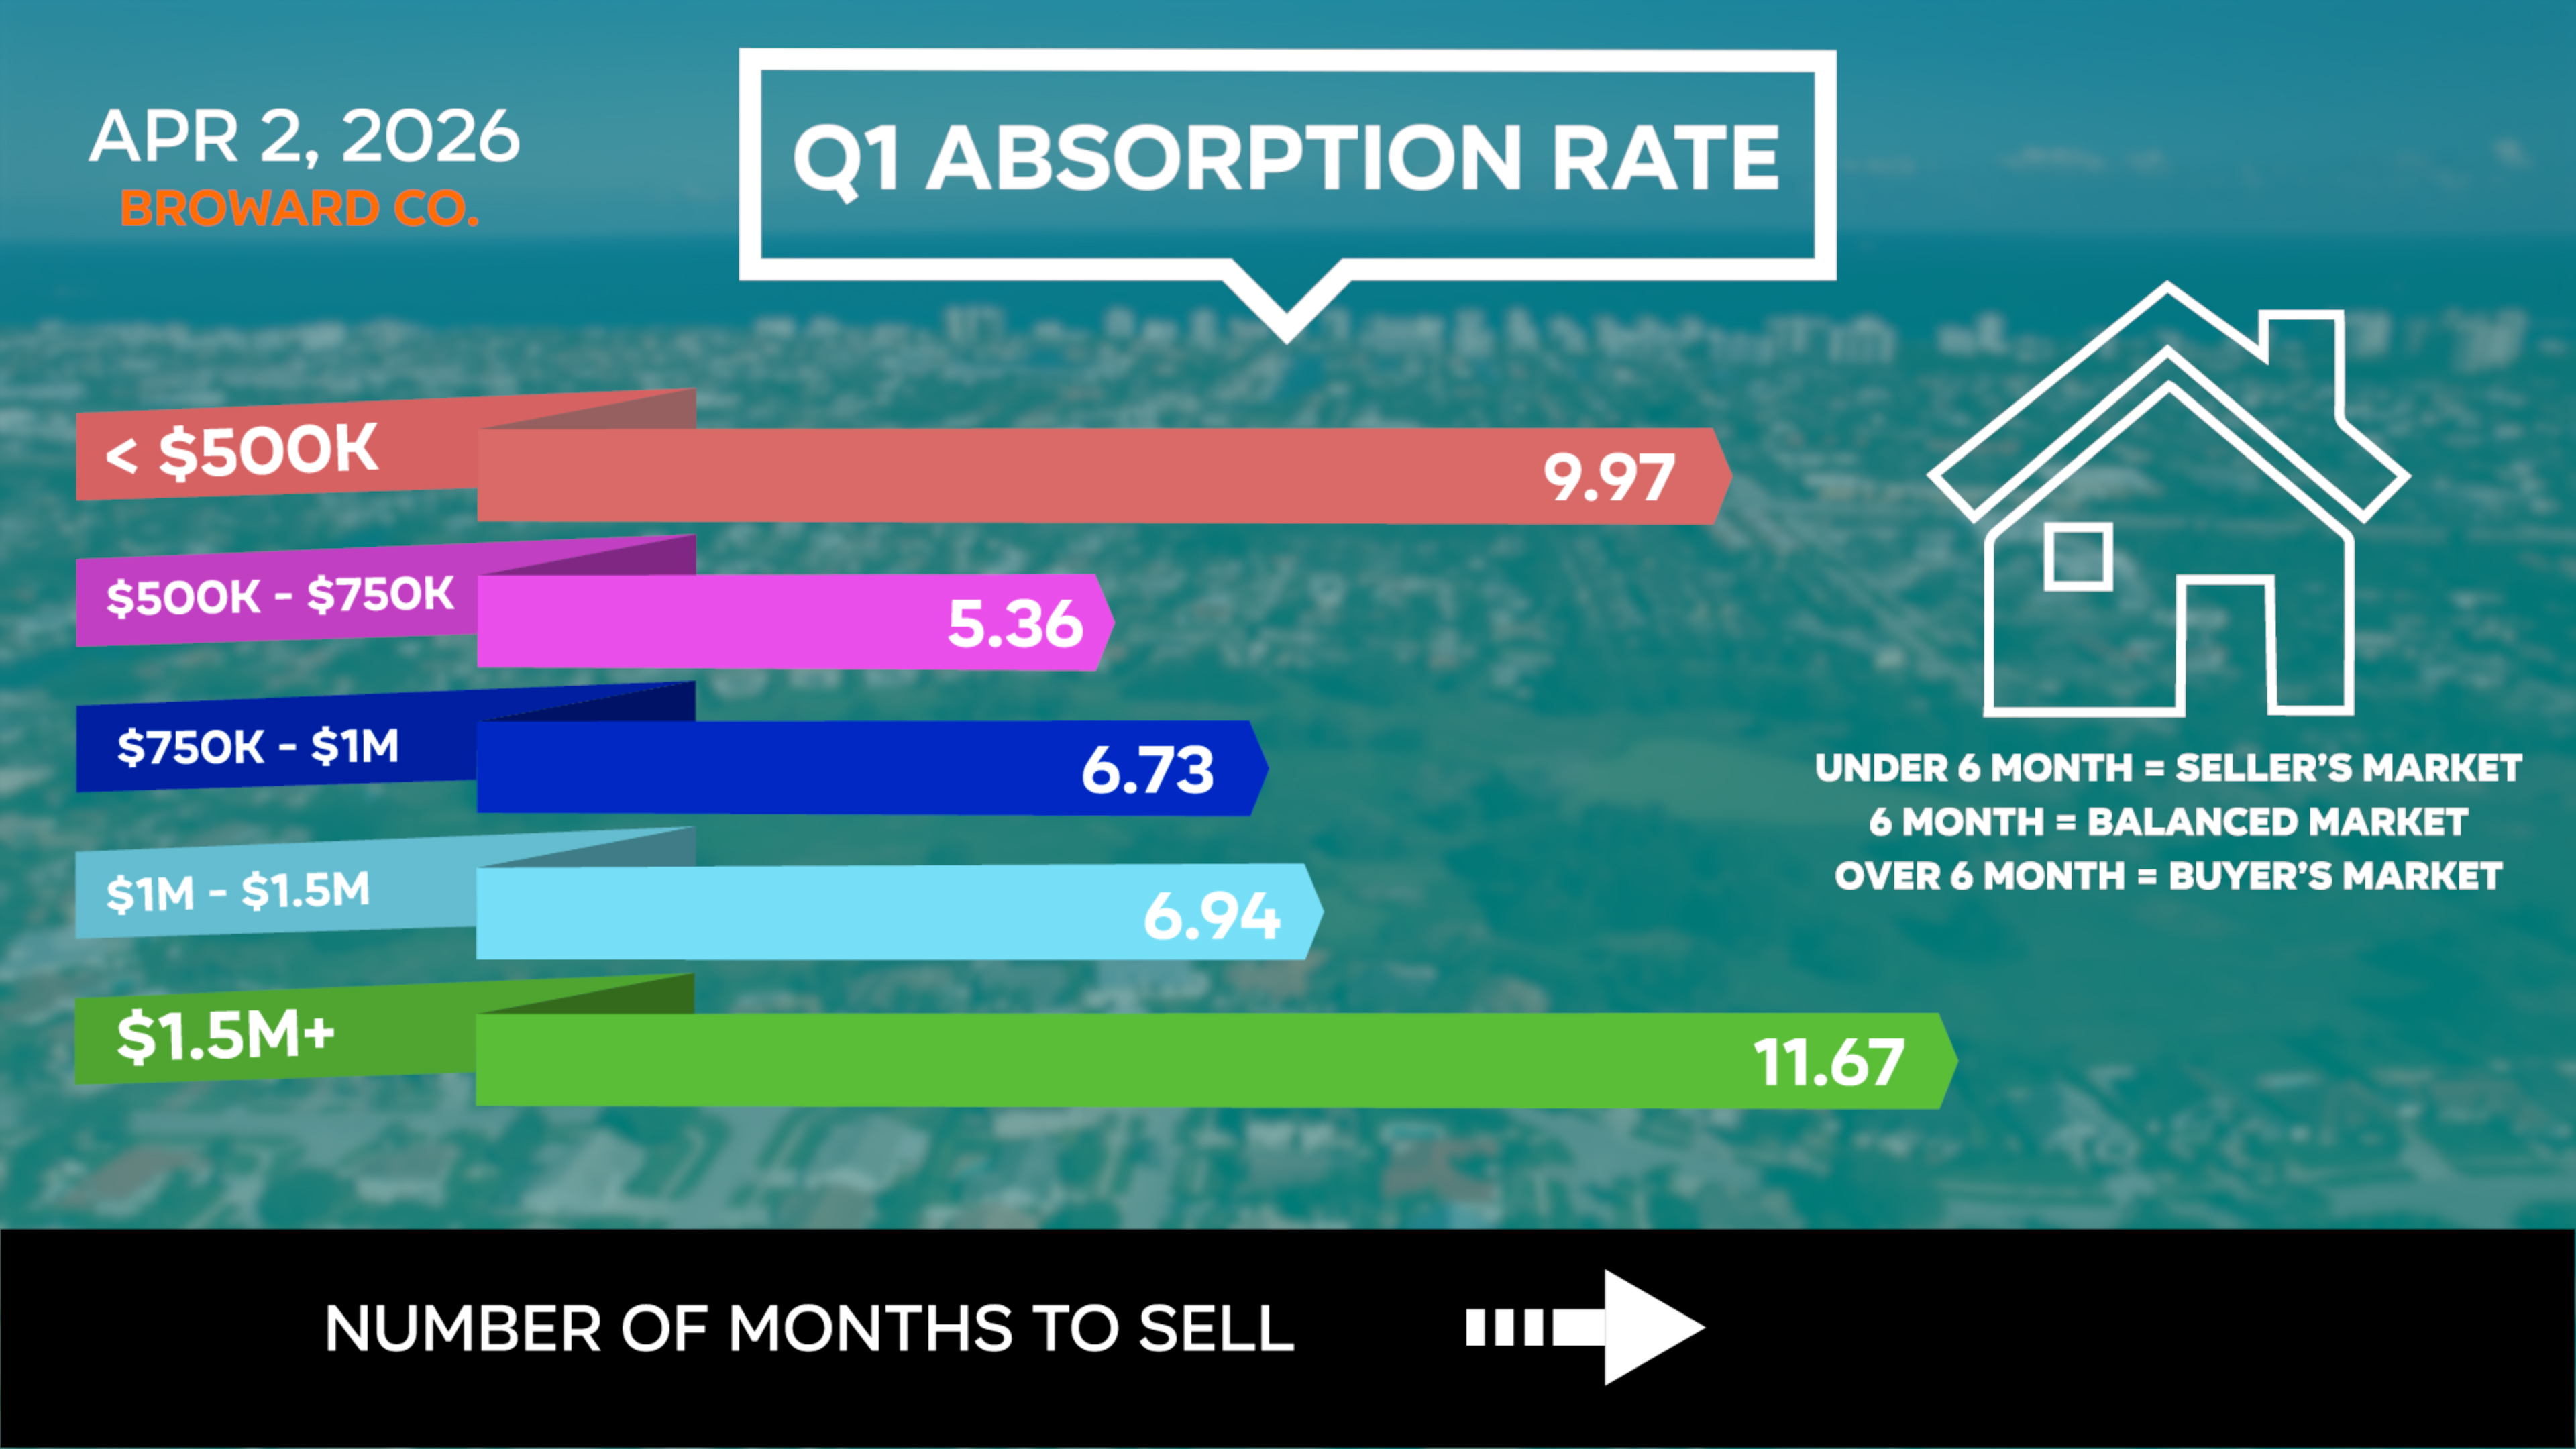
Palm Beach County's overall absorption rate improved from 8.33 months down to 7.15 months. We are moving toward a balanced market. Broward County also improved, from 9.33 months down to 8.63 months. Still in buyer's market territory, but moving in the right direction.
Here is the big news: two price segments in Palm Beach are now in seller's market territory. The $500K to $750K range is at 4.66 months. The $1M to $1.5M range is at 5.25 months. And the luxury market above $1.5M dropped from 12.75 months to 8.22 months. That is a dramatic improvement.
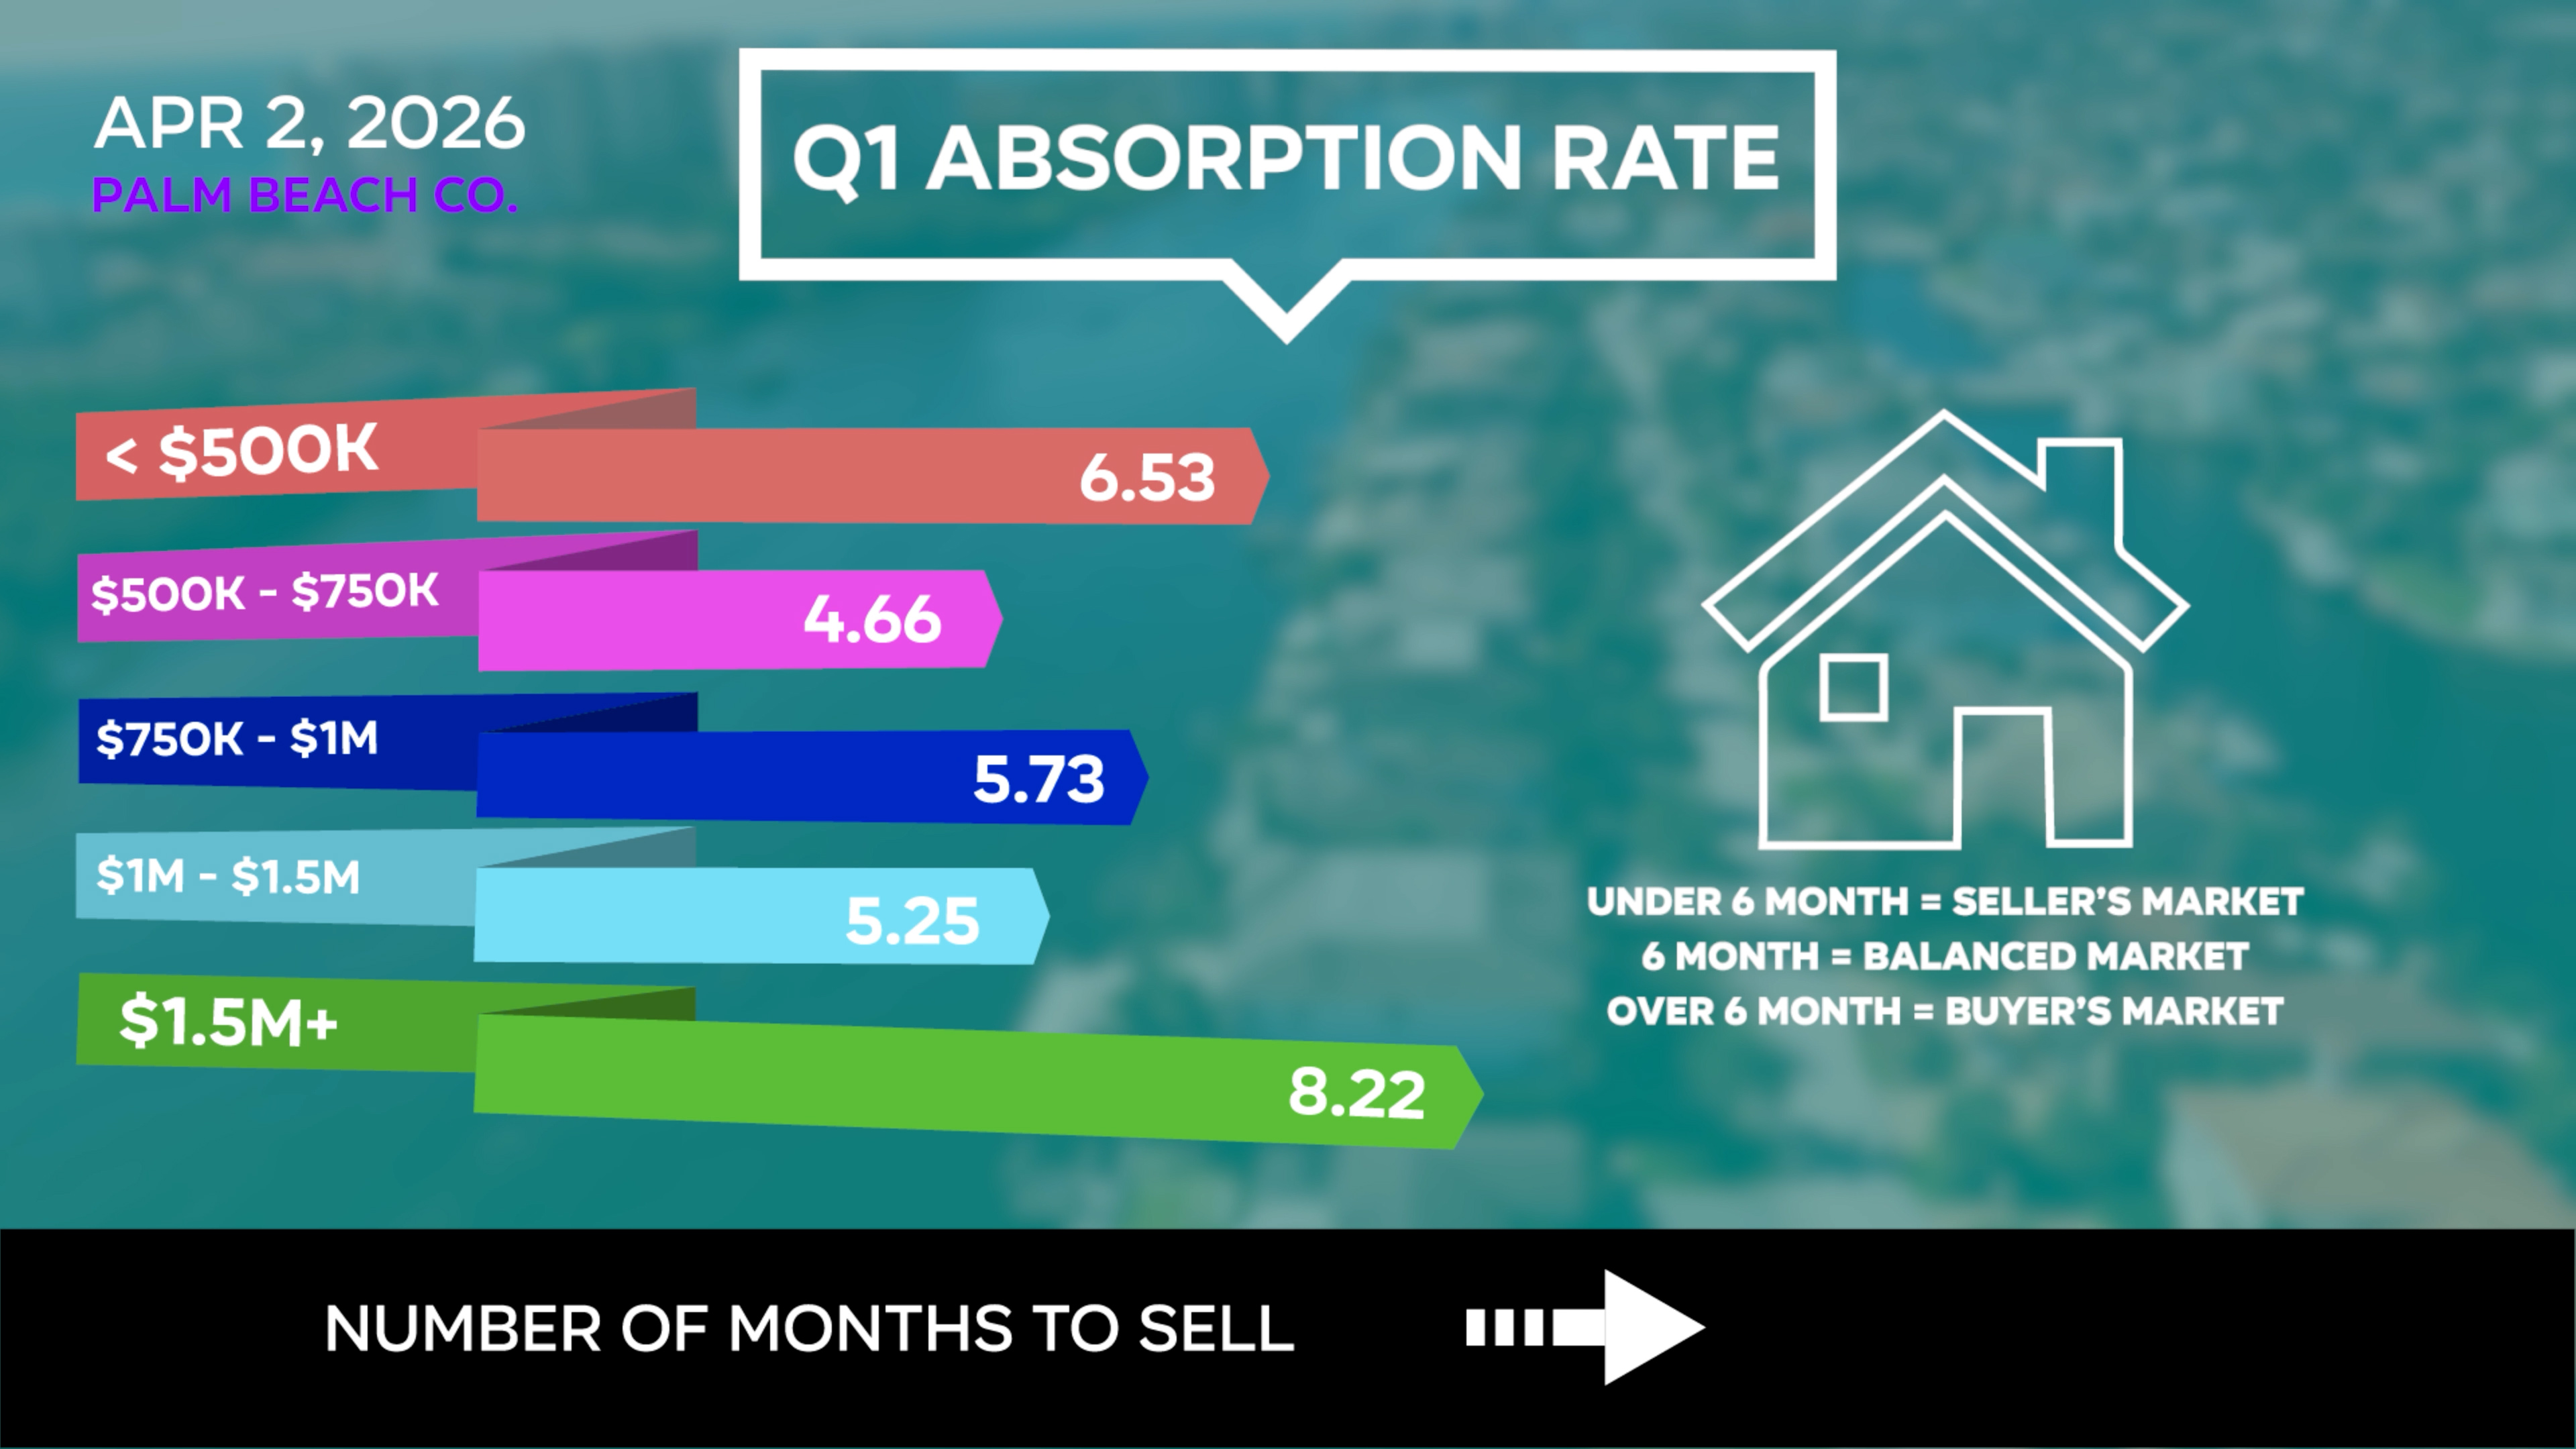
Broward also has good news. The $500K to $750K range is now at 5.36 months. That is seller's market territory. And every price segment in Broward improved from Q1 2025. This is the first time we have seen broad-based absorption rate improvement in a while. The real estate market is getting stronger and more competitive, not weaker.
Keep in mind that conditions vary by city. Buyers shopping in Boca Raton or Delray Beach will find different dynamics than those looking in Fort Lauderdale or Parkland. The county-level data provides direction, but your specific neighborhood and price range will determine what you actually experience.
FAQs about Palm Beach and Broward County Q1 2026
Is now a good time to buy in South Florida?
It depends on your price range. The $500K to $750K segment is competitive in both counties. If you are in that range, waiting could mean more competition as absorption rates tighten. Broward buyers in other price points still have negotiating leverage, but that window may be closing as inventory declines.
Are home prices going up or down in South Florida?
Prices are rising in Palm Beach County (11% average, 3% median year-to-date). Broward is essentially flat at the median level (down 1%) despite the large average increase driven by luxury sales. Neither county is seeing a price crash.
Why is inventory falling in both counties?
New listings dropped 11% in Palm Beach and 15% in Broward in Q1 2026. Fewer sellers are entering the market, likely due to rate lock (owners holding onto low mortgage rates) and stabilizing prices reducing urgency to sell.
Which price range is best for buyers right now?
In Palm Beach, the under $500K segment still favors buyers at 6.53 months of inventory. In Broward, the under $500K market remains slow at 9.37 months, giving buyers significant negotiating room. Luxury buyers ($1.5M+) have the most leverage in both counties.
What is the outlook for the rest of 2026?
If current trends continue, we expect inventory to keep declining and absorption rates to improve further. Palm Beach is likely to see continued price appreciation. Broward should stabilize, with potential for modest growth if under-contract activity translates to closed sales.
Local help for buyers and investors in South Florida
If you are buying, selling, or investing in South Florida, it helps to work with someone who understands how market conditions differ between Palm Beach and Broward counties and how those differences affect your strategy. If you have questions about what this data means for your situation, reach out to The Mastropieri Group, Realtors®.
For practical, hands-on support across South Florida, call (561) 544-7000.
Posted by Larry Mastropieri






Enjoy this blog post? Click here to subscribe for updates

Leave A Comment